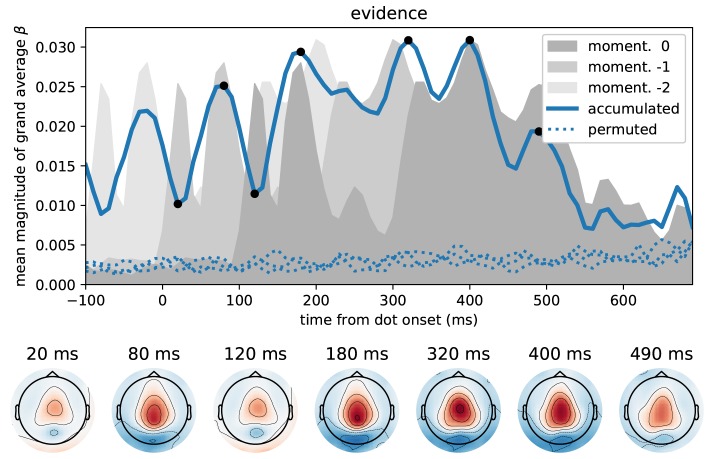
Figure 6.
Correlation of accumulated evidence and magnetometer signals relative to dot onset display central sensor topographies. Format as in Figure 5, i.e., the blue line in the top panel shows the time course of the mean (across sensors) magnitude of grand average regression coefficients (β) together with corresponding time courses after 3 different permutations across trials (dotted). In addition, we show the momentary evidence time course (dark gray shade, cf. Figure 5A) and two replica of it which are shifted by 100 ms to the past (lighter grays). These time courses, therefore, are associated with the representation of the momentary evidence/x-coordinates of the current dot, the previous dot and the dot before that in the brain.

