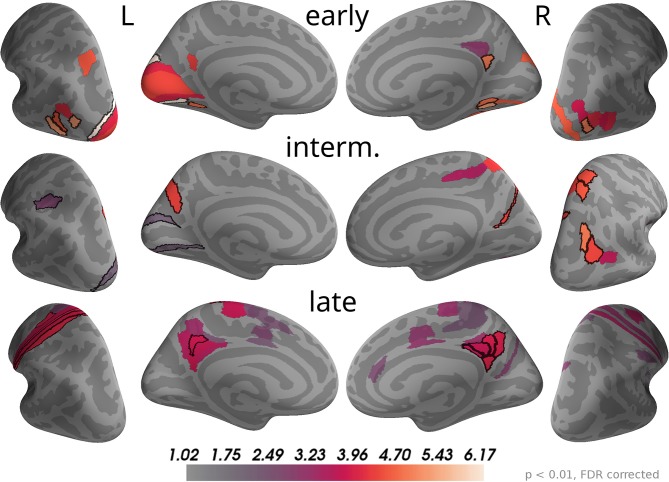
Figure 7.
Correlations with momentary evidence shift from visual over parietal to motor and posterior cingulate areas. We investigated the three time windows with strong correlations in the sensor-level results: early (110–130 ms), intermediate (160–200 ms), and late (290–510 ms). For each of these phases only brain areas with at least one significant effect (p < 0.01, FDR corrected) within the time window are colored. For display purposes, colors show average second-level t-value magnitudes where the average is taken over time points within the time window. The 5 areas with the most consistent, strong correlations per hemisphere and time window are marked by black outlines. These were (in that order; specified as Brodmann areas with subdivisions as defined in Glasser et al., 2016): early, left—V3, FST, LO3, VMV2, MST; right—VMV2, LO1, v23ab, VMV1, VVC; intermediate, left—POS2, AIP, V2; right—IP0, VIP, 7AL, PGp, DVT; late, left—1, 3a, 6d, 3b, 31pd; right—v23ab, 7m, 31pd, 31pv, d23ab.

