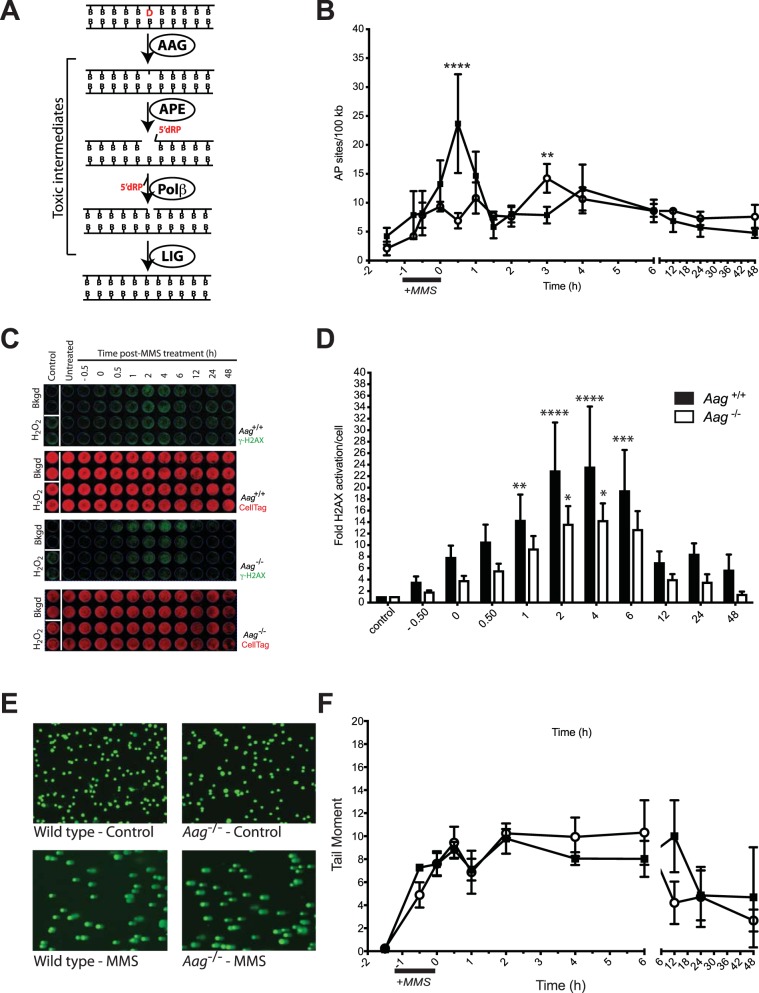
Figure 1.
Alkylation damage is processed to toxic intermediates in Aag−/− cells. (A) A diagram depicting the BER pathway initiated by AAG, showing key enzymatic steps and resulting toxic intermediates, i.e. abasic sites and strand breaks containing a 5’dRP moiety. (B) Aag−/− cells display slower kinetics for AP site formation after treatment with MMS. Formation of AP sites over time following MMS exposure (2.5 mM) was measured in wild-type (filled squares) and Aag−/− (open circles) MEFs. Significant differences between wild-type and Aag−/− cells are indicated by **p ≤ 0.005, and ****p ≤ 0.0001. (C) Activation of histone H2AX over time following MMS exposure (2.5 mM) was measured in wild-type and Aag−/− MEFs. H2O2 was used as a positive γH2AX inducer. Representative images of In-Cell Western plates for fluorescence staining intensity are shown, γH2AX (top, green), and total cell DNA staining by CellTag 700 (bottom, red). (D) Quantification of fluorescence staining intensity for γH2AX normalized to total cellular DNA. Bars represent means ± SEM of normalized staining intensities for at least 4 independent experiments. *p < 0.05, **p < 0.005, ***p < 0.001, and ****p < 0.0001. (E) Representative images obtained using the alkaline comet assay of wild-type and Aag−/− MEFs untreated (control) or after exposure to 2.5 mM MMS. (F) DNA damage detected by alkaline comet analysis, expressed as tail moment, over time following exposure to 2.5 mM MMS in wild-type (filled squares) and Aag−/− (open circles) MEFs. Values presented are the mean ± SEM of three independent experiments.

