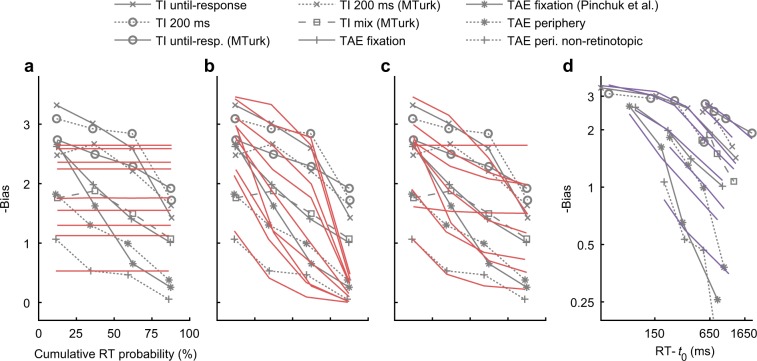
Fig. 8. Modeling the reduction in context-dependent bias.
Shown is bias (Eq. (1)) as a function of RT, averaged across observers, in models and in the behavioral context experiments (gray lines, reproduced from Fig. 4 cd). a–c Bounded model (DDM, red lines), measured in four RT bins, where the influence of a context change (−20° vs. +20°) is modeled as a (a) drift rate change, b starting point change (same model as in Fig. 7), c drift rate and starting point change (see the Methods). d Unbounded model (purple lines), where the influence of a context change is modeled as a change in starting point in an unbounded diffusion process. This model was analyzed by fitting bias to a decay rate function (see the Methods). The t0 measures the non-decision time (10–550 ms; using a fixed value of 350 ms obtained from the RT distributions gives similar results). Note that the x-axis in panels a–c is for relative RTs (i.e., cumulative RT probability), while panel d is for physical RT (time difference from t0), which is reasonable considering the different models. Fitting was done on the group level. Overall, the different modeling approaches (panels c, d) can qualitatively account for a slow rate of reduction in bias.

