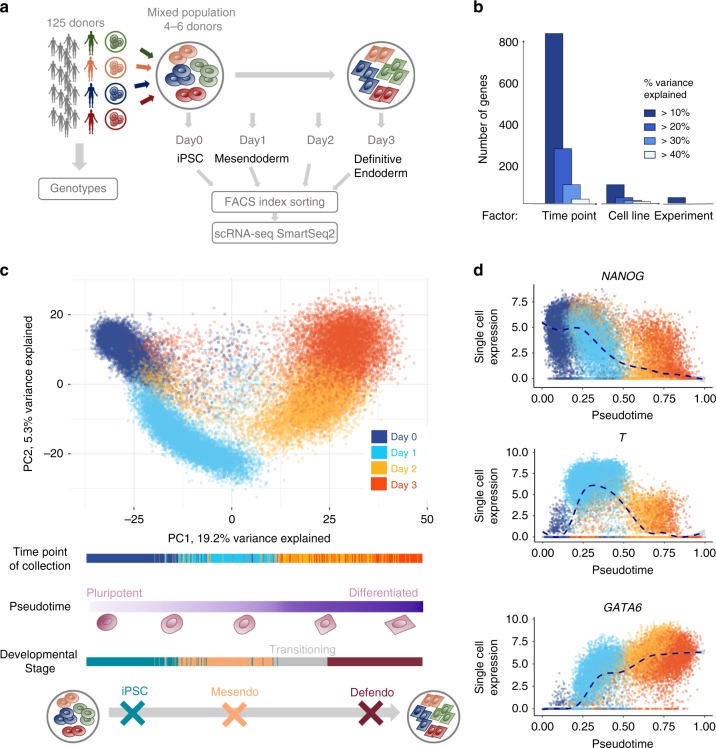
Fig. 1. Single-cell endoderm differentiation of pooled iPSC lines.
a Overview of the experimental design. iPSC lines from 125 genotyped donors were pooled in sets of 4-6, across 28 experiments, followed by differentiation towards definitive endoderm. Cells were sampled every 24 h (Methods) and molecularly profiled using scRNA-seq and FACS. https://github.com/ebiwd/EBI-Icon-fonts by EBI Web Development is licensed under CC BY 4.0. b Variance component analysis of 4,546 highly variable genes, using a linear mixed model fit to individual genes to decompose expression variation into time point of collection, cell line and experimental batch (Methods). c Top: Principal component analysis of gene expression profiles for 36,044 QC-passing cells. Cells are coloured by the time point of collection. Bottom: Cells are ordered by pseudotime, defined as the first principal component (PC1). From left to right, cells transition from a pluripotent state to definitive endoderm. d Single cell expression (y-axis) of selected markers for each developmental stage, spanning iPSC (NANOG), mesendo (T), and defendo (GATA6) stages, plotted along pseudotime (x-axis).

