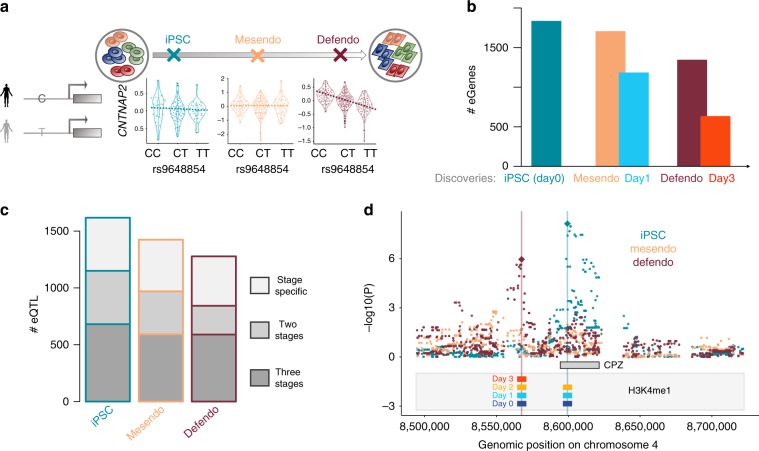
Fig. 2. Mapping single-cell eQTL in each developmental stage.
a Illustration of the single cell eQTL mapping strategy at different stages of differentiation. Shown is an example of an eQTL that is specific to the definitive endoderm (defendo) stage. Boxplots of gene expression stratified by the allelic state of rs9648854 at each stage, showing an association between rs9648854 and CNTNAP2 expression at the defendo stage, but not at earlier stages. https://github.com/ebiwd/EBI-Icon-fonts by EBI Web Development is licensed under CC BY 4.0. b Comparison of eQTL mapping using different strata of all cells. Stage definition based on pseudotime ordering increases the number of detectable eQTL, compared to using the corresponding time point of collection. Bars represent number of eGenes (genes with at least one eQTL, at FDR < 10%). c Proportion of eQTL that are specific to a single stage, shared across two stages, or observed across all stages (sharing defined as a lead eQTL variant at one stage with nominal significant effects P < 0.05 and consistent direction at another stage). d A lead switching event consistent with epigenetic remodelling. The overlap of H3K4me1 with the eQTL SNPs across differentiation time points is indicated by the coloured bars.

