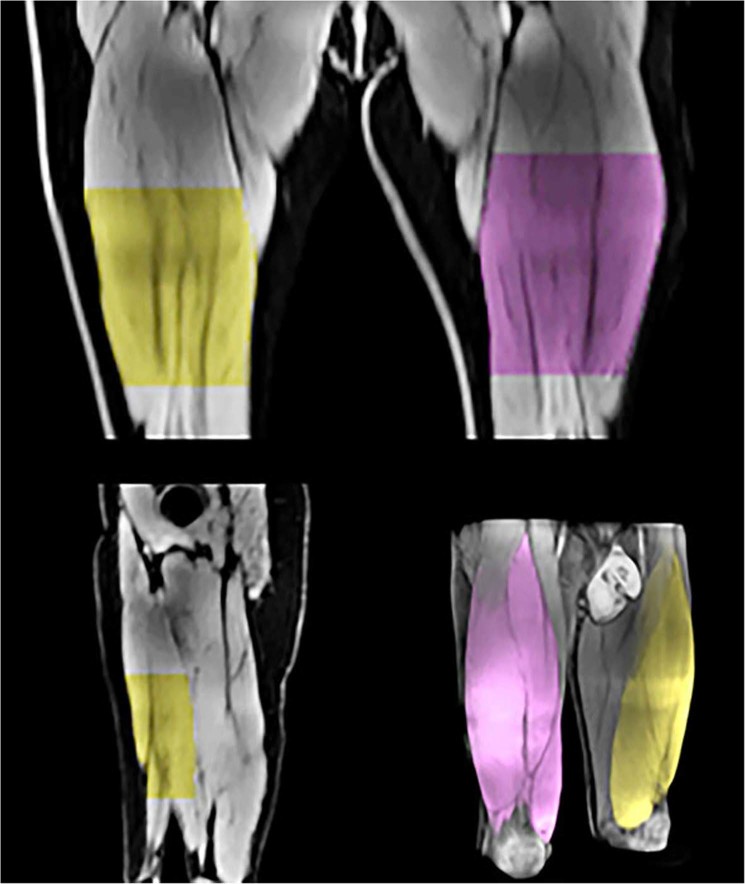
Figure 2.
Illustration of the automatic detection of the targeted partial muscle volume, as well as the whole quadriceps femoris volume (bottom right). The partial volume was calculated between points-of-interests (proximal and distal start/stop image) that were placed in the first slice not showing the gluteus maximus muscle and the last slice still including the rectus femoris on both sides as described in the manual analysis (see text for further details). The upper panel displays the detected partial region of the quadriceps in the frontal plane (anterior view). The bottom left panel display the detected region in the sagittal plane.

