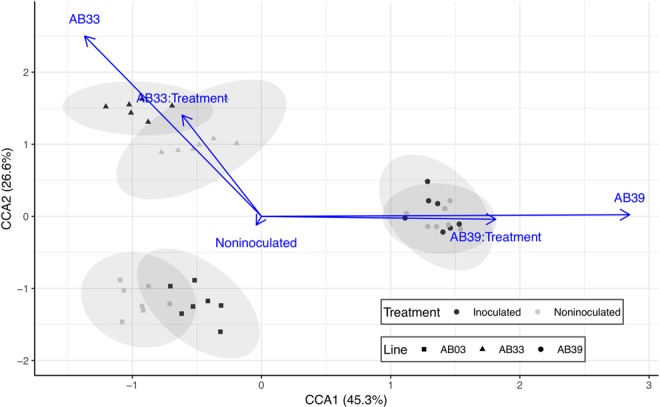
Figure 2.

Differences in global metabolome of three bermudagrass lines inoculated and noninoculated with sting nematode. Axes represent first two orthogonal axes from canonical correspondence analysis with percentages indicating relative contribution of each axis to constrained (or 42% of observed inertia of the global metabolome). Points represent the metabolome of individual bermugrass replicates projected into ordination space. Ellipses are 95% confidence intervals for each treatment-line combination. Blue arrows represent explanatory variables; direction of arrow depicts direction of the gradient while length denotes relative (scaled) importance.
