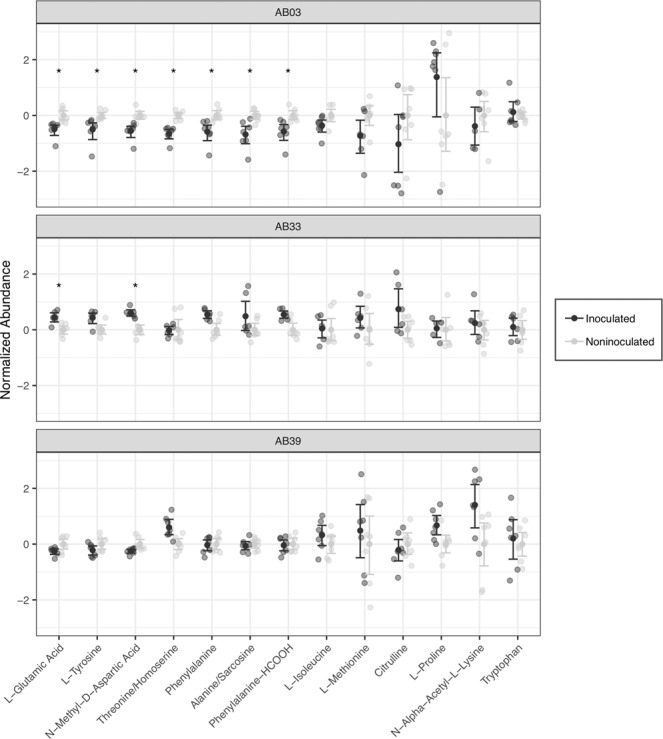
Figure 4.

Normalized abundances of amino acid related compounds across three different bermudagrass lines inoculated and not-inoculated with sting nematode. Abundances are normalized by compound and line to facilitate visual comparison. Transparent points are individual observations; solid points and error bars denote mean and 95% bootstrapped confidence intervals respectively. Significant difference between plants with and without sting nematode are denoted by asterisks and was determined by Wilcoxon Sign Rank tests on non-normalized abundances with correction for the false discovery rate.
