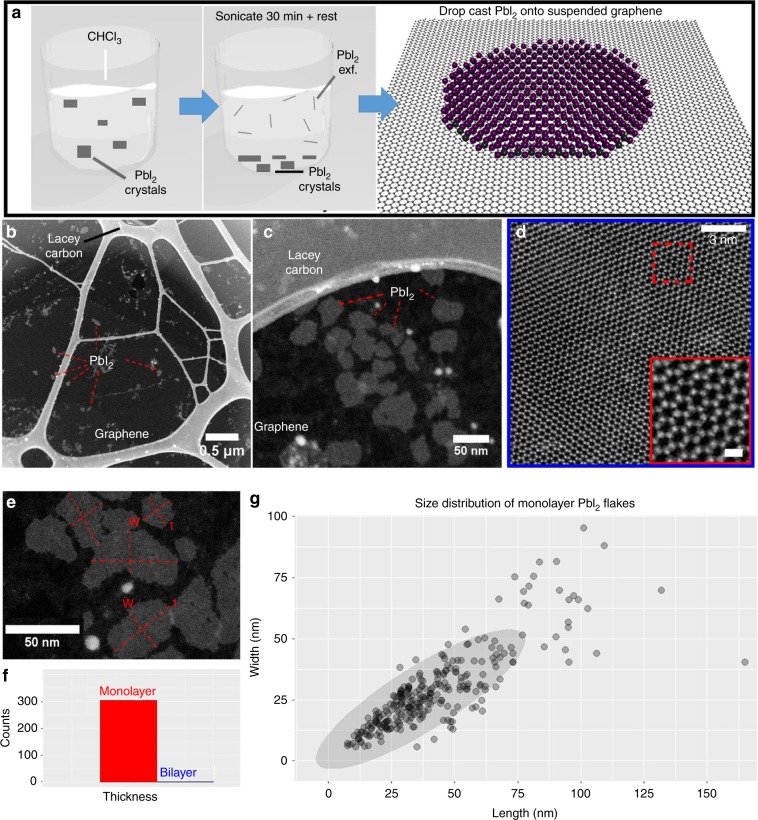
Fig. 1. Schematic diagram for liquid exfoliation and results.
a Schematic of the LPE synthesis of monolayer PbI2 flakes and deposition on to suspended graphene. b, c ADF-STEM image of monolayer PbI2 flakes at different magnifications. d Atomic resolution ADF-STEM image of a monolayer PbI2 flake. The inset in the figure shows an atomic resolution image of the structure. The scale bar is 0.5 nm. e Typical method for measuring the length(l) and width(w) of the monolayer flake. f Histogram showing the thickness distribution of PbI2 flakes. g Plot of the size distribution for >300 monolayer flakes. Overlapping sizes of different flakes show darker color for their marker dots. The oval represents the highest congregation of flake sizes in the overall sample distribution.

