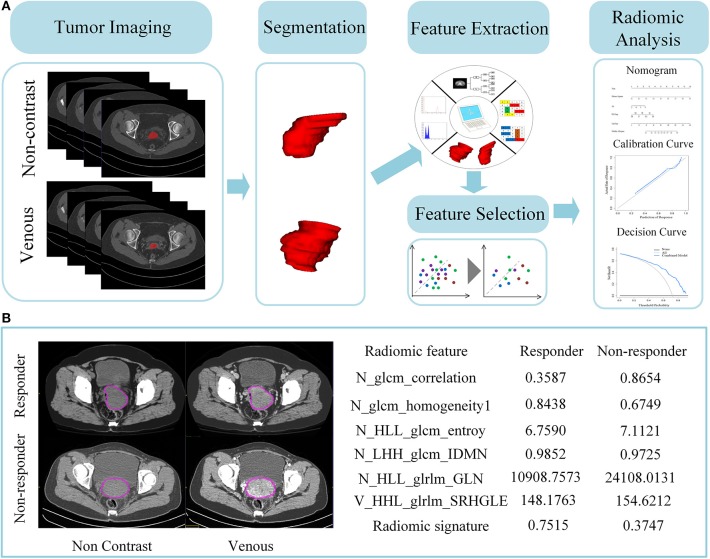
Figure 2.
A schema for radiomics pipeline. (A) Flowchart of the study. One thousand and twenty-four features were extracted from pre-therapy CT scans. Both extracted radiomic features of non-contrast and venous enhanced images are pooled as part of following feature selection analysis. After chosen by five different feature selection methods, the final top predictive features were then constructed as radiomics signature by Random Forest. Finally, radiomics signature and clinical factors were combined into a nomogram. (B) Difference of quantitative radiomic features and predictive probability between chemotherapy responder vs. non-responder. Left images are their corresponding pre-therapeutic CT non-enhanced and venous enhanced images. ROIs are drawn in a purple circle. Right graph indicated the value of radiomic features and predictive probability derived from radiomics signature.

