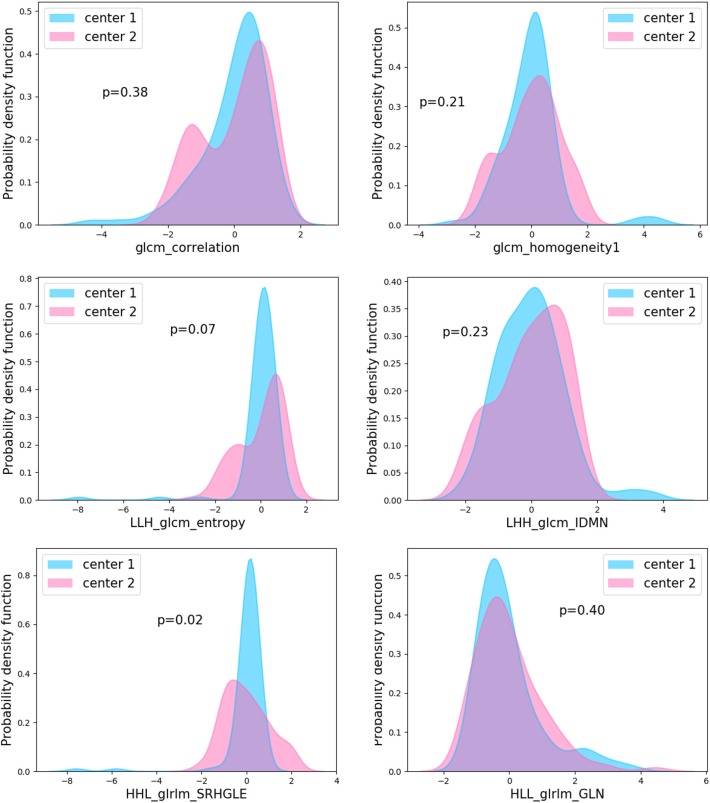
Figure 3.
Probability density function of features between centers. Comparison of the six derived features between two hospitals with largest numbers of patients revealed no significant difference exist in the five features from non-contrast CT images (glcm_correlation, LLH_glcm_entropy, HLL_glrlm_GLN, LHH_glcm_IDMN, glcm_homogeneity1) (P > 0.05). “HHL_glrlm_SRHGLE” features from venous-enhanced images showed slight difference. P values are for Mann-Whitney U-test.

