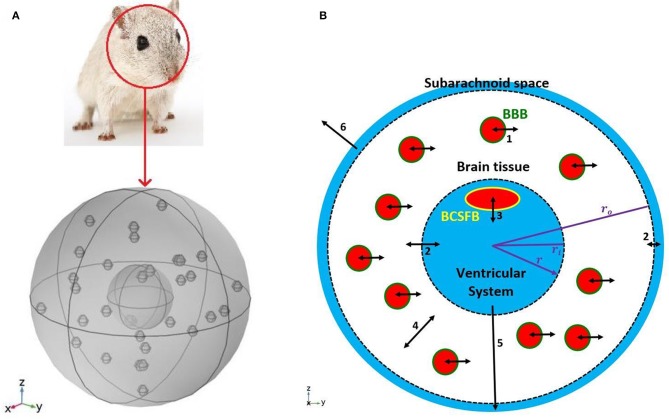
Figure 1.
Schematic of the model. (A) A 3D model of a rat's brain. (B) A 2D view of the cross section of the 3D model. The inner circle, shown in blue, represents the ventricular system, while the outer ring, shown in blue, is subarachnoid space. The white region between two dashed circles is brain tissue. Blood vessels, shown in red filled circles, are distributed uniformly in the brain tissue. The green circular border which separates blood from the brain tissue is the BBB. The BCSFB which is depicted by a yellow ellipsoid separates blood from the ventricular CSF. Numbers in the figure specify the types and locations of sodium transport: 1. capillary-brain transport across the BBB; 2. exchange between CSF and ISF; 3. blood-CSF exchange across the BCSFB; 4. diffusive transport in the radial direction in the brain tissue; 5. transport by the CSF flow from the ventricular system to the subarachnoid space; 6 transport by the CSF flow from the subarachnoid space to the blood. Arrows 5 and 6 indicate CSF flow direction from the ventricular system to the subarachnoid space, and from the subarachnoid space to the blood. Although CSF flow has been modeled (Equations 1 and 2), the model does not include actual channels for transferring CSF flow between the ventricular system, subarachnoid space and blood. It should be noted that the size and number of the graphic symbols of blood vessels, as well as the size of the graphic symbol of choroid plexus (a.k.a BCSFB) do not represent their realistic values given in Table 1.

