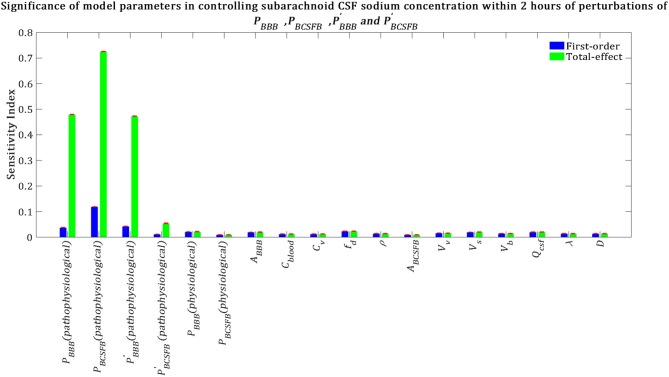
Figure 6.
Relative significance of the model parameters in controlling subarachnoid CSF sodium concentration (Cs) within 2 h of the perturbation onset (tmax = 2 h). The blue bars represent first-order sensitivity indices, while the green bars show the total-effect sensitivity indices. The error bars, shown in red, indicate the bootstrap confidence intervals (95% confidence intervals) of the mean values.

