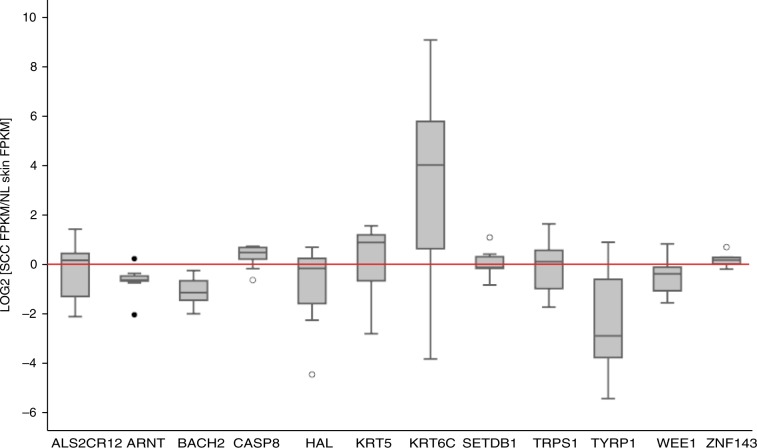
Fig. 2. Gene expression analysis for novel SCC susceptibility loci.
RNA-seq data were obtained from Gene Expression Omnibus (GSE84194) were analyzed by DESeq. Transcript levels (FPKM) in SCC samples were compared with levels in paired matched normal skin. Boxplot demonstrates log2[SCC/Normal skin] expression levels for 13 genes surrounding the novel SNPs. Legend for box and whisker plots. The black center line denotes the median value (50th percentile), while the gray box contains the 25th to 75th percentiles of data set. The black whiskers mark the 5th and 95th percentiles, and values beyond these upper and lower bounds are considered outliers, marked with white circles. The red threshold line indicates the point where these is no change in gene expression between SCC tumor and normal skin. ARNT, BACH2, TYRP1, and WEE1 were significantly downregulated in SCC as compared with normal skin and CASP8 and KRT6C were upregulated in SCC relative to normal skin by DESeq.

