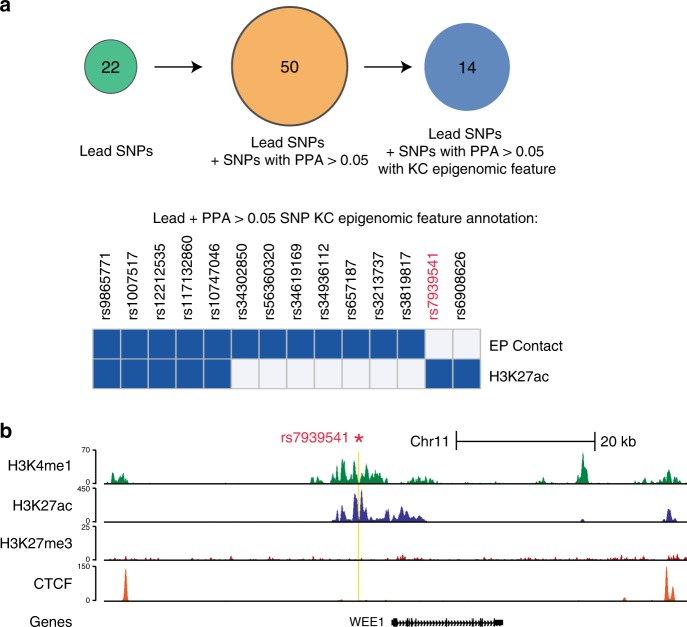
Fig. 3. Annotation of novel SNPs with epidermal enhancer information.
a Top: Circles represent the number of SNPs considered at each stage of the workflow to identify epigenetic context of all novel SNPs. We started with 22 lead SNPs identified by meta-GWAS, then found putative causal SNPs defined as any SNPs with a PPA of >0.05 from our fine-mapping analysis. We next refined that expanded list to SNPs for which the genomic location overlapped a previously identified epigenomic feature (either the H3K27ac enhancer mark or ends of an enhancer–promoter contact). Bottom: Heatmap displaying the overlap of SNPs with enhancer–promoter contacts or H3K27ac marked regions. The blue designation indicates that the SNP overlaps at least one H3K27ac region or contact. b Genome browser tracks for the genomic locus for SCC-index SNP rs793954, PPA > 0.99, demonstrating enhancer features in primary human keratinocytes (KC). ChIP-seq signal tracks are displayed for H3K4me1 and H3K27ac (which typically mark active enhancers and promoters) as well H3K27me3 (which marks inactive loci). Yellow denotes SNP location; note this SNP falls in a region marked by H3K27ac and H3K4me1 enhancer-associated histone marks, with lack of the repressive H3K27me3 mark. CTCF sites indicate that the SNP is not involved in CTCF loops and associated TADs.

