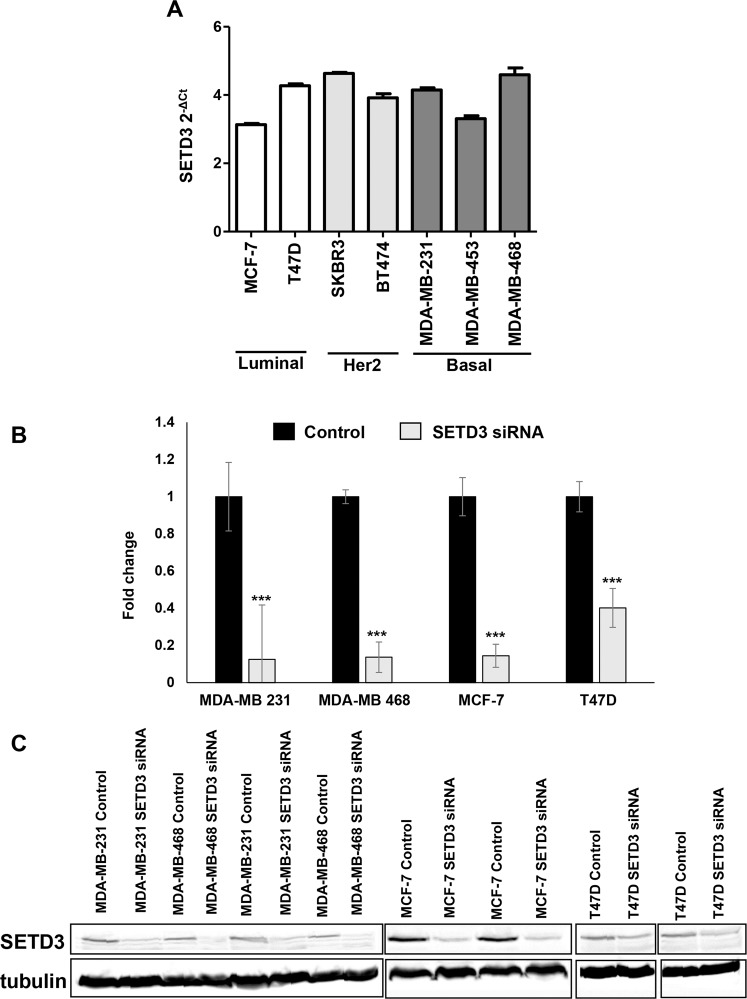
Figure 4.
Expression of SETD3 in breast cancer cell lines. (A) Relative expression of SETD3 was quantified by qRT-PCR in 7 breast cancer cell lines representative of the luminal (MCF-7 and T47D), Her2-positive (BT474 and SKBR3), and basal (MDA-MB-231, -453 and -468) subtype. Individual experiments were normalized against β-ACTIN and the relative expression was represented by 2-ΔCt. (B,C) The expression of SETD3 was blocked with an siRNA in basal breast cancer cell lines MDA-MB-231 and -468, and Luminal cell lines MCF-7 and T47D. Knockdown of SETD3 was confirmed by B) qRT-PCR and C) western blot. Western blot images are composites of individual blots as indicated by separated boxes. Tubulin signals are derived from the same stripped and reprobed membranes as the corresponding SETD3 signals shown in the upper panels. Full-length blots are shown in the Supplementary File, Supplementary Fig. S1. Data represent the mean ± SEM (standard error of the mean) from 3 independent experiments in triplicates. Bars with asterisks represent comparisons with statistically significant differences (P < 0.05).

