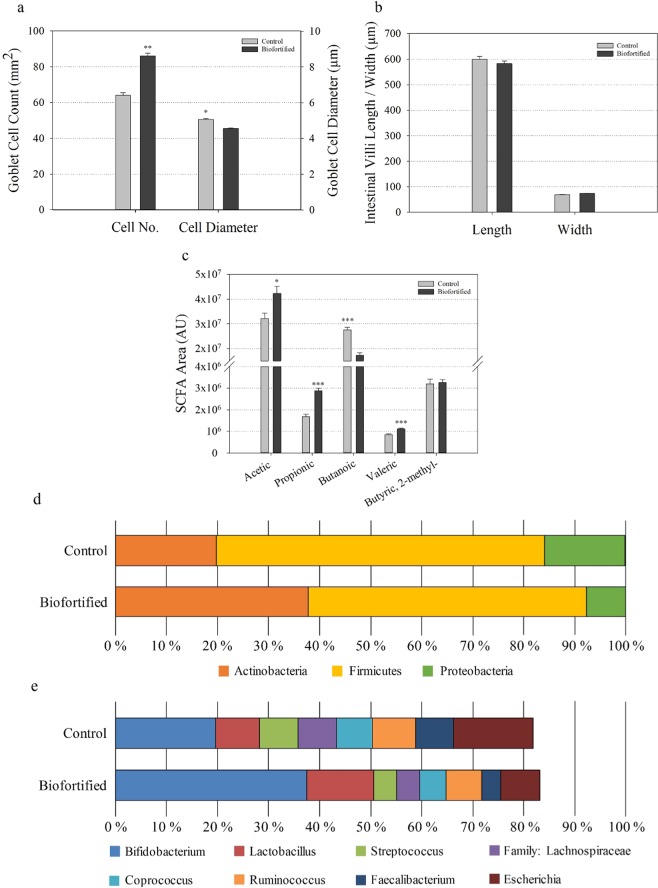
Figure 4.
Intestinal functionality, short-chain fatty acid production and cecal microbial composition following consumption of experimental diets. (a) Chicken intestinal goblet cell number and diameter (µm). (b) Chicken intestinal villi length and width (µm). (c) Cecal short-chain fatty acid (SCFA) composition. Bars represent mean ± SEM of nine biological replicates. Relative abundance of microbial populations at the levels of (d) phyla; and (e) families and genera. Asterisks denote significant differences for *p < 0.05, ***p ≤ 0.001 as determined by Student’s t-test. AU: arbitrary units.

