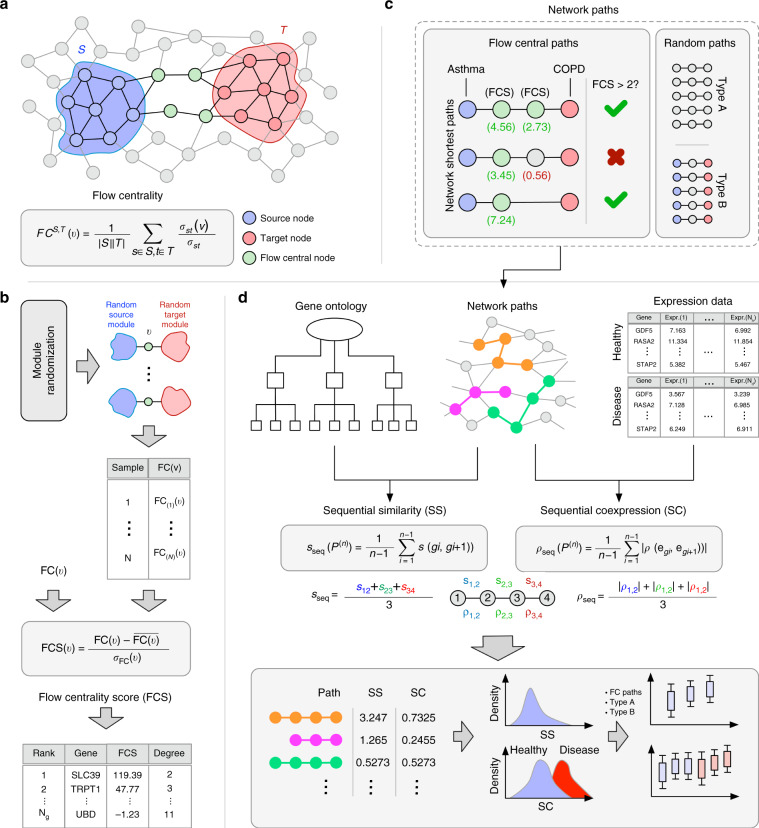
Fig. 1. Overall scheme of the analysis.
a Flow centrality measure. The source nodes (blue) are connected to the target nodes (red) preferentially through high flow centrality nodes (green). b Flow centrality score calculation. 1000 samples are generated through the randomization scheme explained in Methods section. For each node, its FC score is compared with its corresponding values in the random samples and a z-score is obtained, defined as flow centrality score (FCS). c Flow central paths are selected among the shortest paths between asthma and COPD seed genes. The selection condition is that all the intermediate genes in the paths have a FCS >2. Two sets of 10,000 random paths are extracted (Type A, length-preserved, and Type B, endpoints-preserved), for a total of three sets of paths. d starting from each sets of network paths, GO annotations and GEO expression data, the sequential similarity and sequential coexpression values are calculated and compared.

