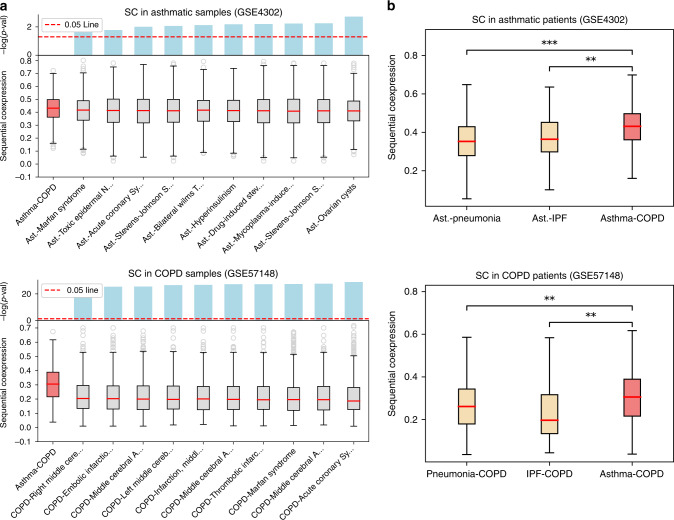
Fig. 5. Sequential coexpression of random paths connecting to unrelated phenotypes.
a Sequential coexpression (SC) of the FC paths compared with random paths between the asthma module and each DisGeNet phenotype (top) and between the COPD module and each DisGeNet phenotype (bottom). For clarity only the top 10 phenotypes are shown, ordered by increasing significance. b (top) SC distribution of the asthma-COPD pair compared with SC of the asthma-pneumonia and asthma-IPF pairs, evaluated on asthmatic samples of GSE4302 data. b (bottom) SC distribution of the asthma-COPD pair compared with SC of the COPD-pneumonia and COPD-IPF pairs, evaluated on COPD samples of GSE57148 data. In the boxplots, boxes indicate the quartiles, whiskers extend to an additional 1.5 * IQR interval, and the medians are highlighted in red. One, two, and three asterisks, respectively, denote a Mann–Whitney p-value that is <0.05, 1e−4, and 1e−10, and “n.s.'' stands for a non-significant result.

