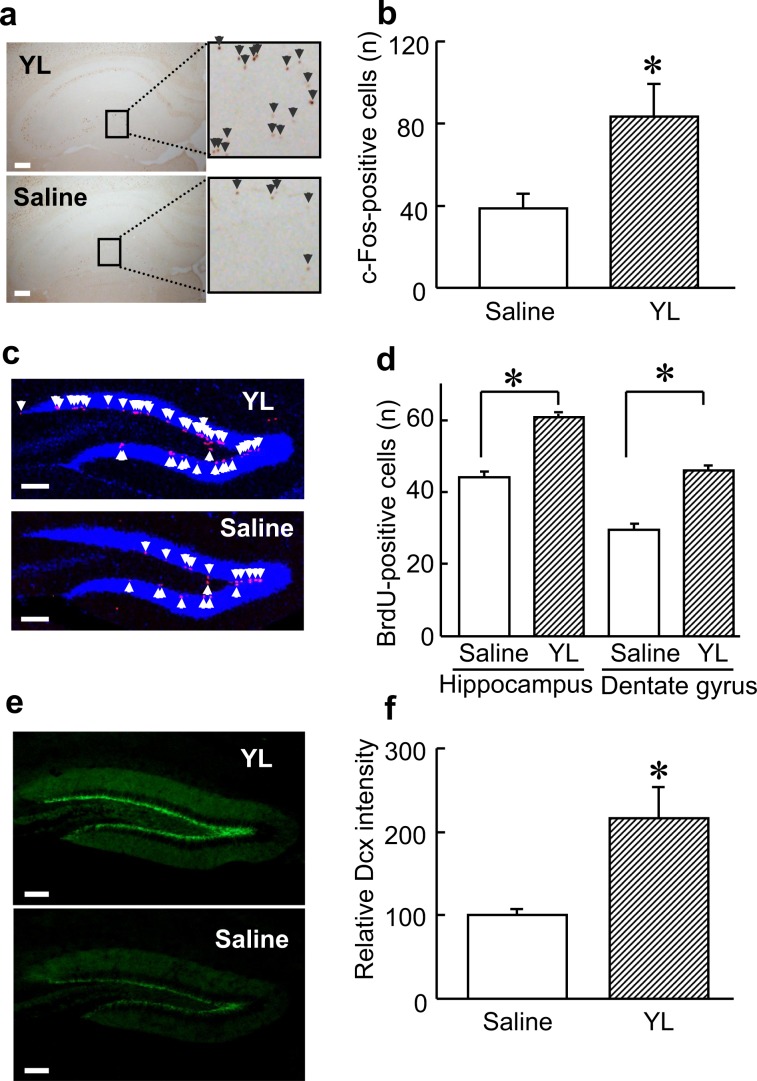
Figure 2.
YL activates hippocampal cells and exhibits cell proliferation in the hippocampal dentate gyrus in vivo. (a,b) Immunostaining of the c-Fos protein. Hippocampal neuronal activity was evaluated by counting c-Fos-positive cells (n = 4). Scale bar, 100 μm. Values are expressed as the mean ± S.E.M. *P < 0.05 compared with each group by nonparametric Mann–Whitney U test. (c,d) Co-immunofluorescence staining of BrdU (red) and DAPI (blue). Hippocampal neuronal cell proliferation was evaluated by counting BrdU-positive cells in the whole hippocampus and dentate gyrus (n = 4). Values are expressed as the mean ± S.E.M. *P < 0.05 compared with each group by nonparametric Mann–Whitney U test. Scale bar, 100 μm. (e,f) Immunofluorescence staining of Dcx (green). Hippocampal neural maturation was evaluated by immunofluorescence intensity using Image J software (n = 4). Scale bar, 100 μm. Values are expressed as the mean ± S.E.M. *P < 0.05 compared with each group by nonparametric Mann–Whitney U test.

