Figure 8.
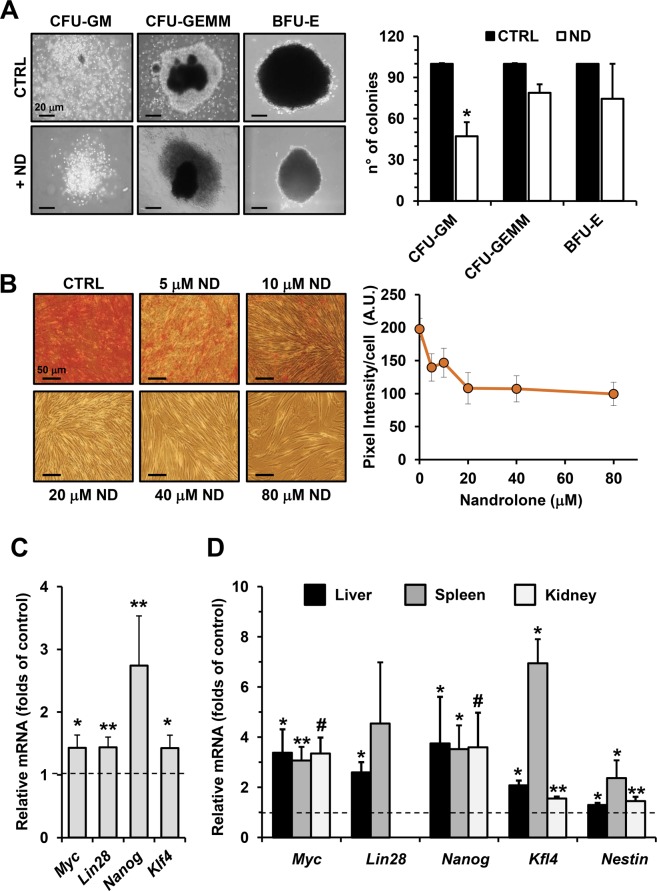
Nandrolone triggers the gain of stemness in several primary non-cancerous cells model. (A) Effect of nandrolone on colony formation ability of CD34+ HS/PC in vitro. Left panel: representative images of CFU-GEMM, CFU-GM and BFU-E scored under an inverted microscope (magnification 40X) are shown. Right panel: quantitative analysis of CFU-GEMM, CFU-GM and BFU-E derived by CD34+ cells isolated form human umbelical cord blood with or without 80 μM nandrolone. ND was added to methylcellulose based medium at time of plating and colonies were detected and enumerated after 14 days of culture as described in Material and Methods. Results shown represent the mean of ± SD of two independent experiment, *P < 0.05 vs CTRL. (B) Effect of nandrolone on calcific deposition during osteogenic differentiation of dental pulp mesenchymal stem cell (DPSCs). Mineral matrix deposition was assayed by Alizarin Red (red staining) in DPSCs incubated with vehicle (CTRL) cells and cells treated with several doses of nandrolone after 21 days in osteogenic conditions. The graph on the right shows quantitative analysis of alizarin red staining carried out by a densitometric analysis (Image J software). (C) Nandrolone treatment induces stemness genes expression during osteogenic differentiation of dental pulp stem cell. Quantitative reverse transcriptase PCR analysis for Myc, Lin28, Nanog, Kfl4 in DPSCs incubated for 21 days in osteogenic medium with 80 μM nandrolone. Data are the mean ± SEM of normalized transcript levels of five independent experiment from 5 independent donors. Per each gene evaluated, fold change value of transcript level in nandrolone treated cells compared to untreated cells (indicated by dashed line) is shown, *P < 0.05; **P < 0.01. (D) Nandrolone elevates stem cells genes expression in vivo. Real time-PCR evaluation of stemness gene expression after nandrolone administration in mice model as describe in Material Methods. For each gene, relative expression levels of transcripts of nandrolone treated mice compared to animals treated with vehicle (dashed line) are shown. The graphs show normalization with the reference gene of Myc, Lin28, Nanog, Kfl4, Nestin expression in several tissues, as spleen, kidney and liver. Data are the mean ± SEM of normalized transcript levels of 3 independent biological experiment. *P < 0.05; **P < 0.01; #P < 0.001.

