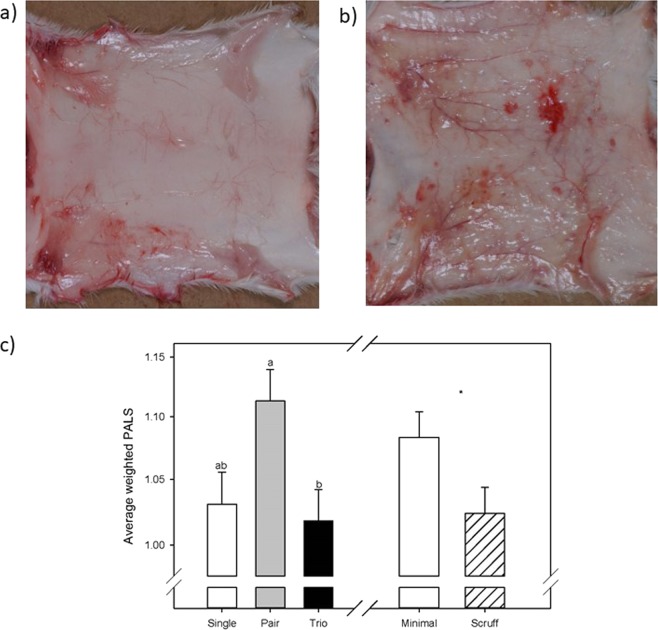
Figure 1.
(a) False positive PALS (Photo ID 4885, animal ID 102, single, 7 weeks, minimal handling). Spots on the inside right flank, some small spots on the back and neck area. (b) True positive PALS (Photo ID 4766, animal ID 7, pair, 5 weeks, minimal handling). Spots everywhere but not the tail area, vessels, no pigmentation like seen in B6. (c) Average weighted PALS LSM ± SE are plotted. Data on the y-axis is represented as a log10 transformed scale but values have been backtransformed to be meaningful in the real world. Different letters above bars indicate significant differences by post-hoc Tukey tests (P < 0.05).

