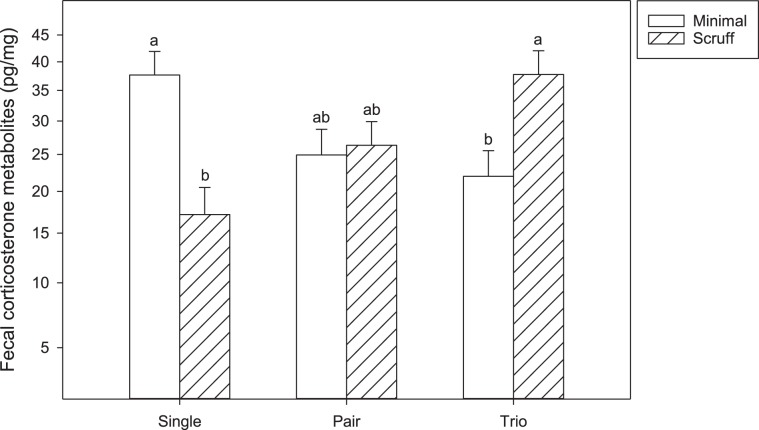
Figure 5.
Fecal corticosterone metabolites from baseline data only. Baseline was the only time point that showed significant differences via test slices. Therefore, only baseline data has been graphed. Data are represented on the y-axis as a square root transformed scale but values have been backtransformed to be meaningful in the real world. Different letters above bars indicate significant differences by post-hoc, Bonferroni corrected, T-tests (P < 0.0055).

