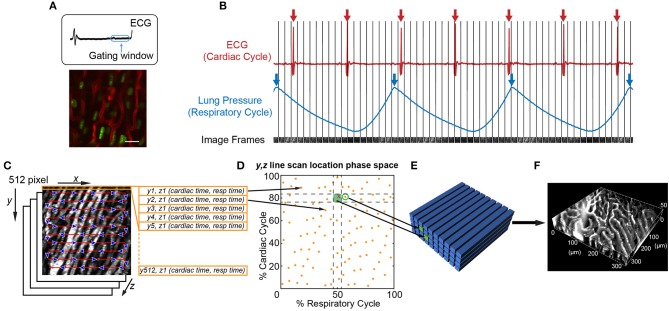
Figure 2.
Image acquisition and reconstruction techniques for the beating mouse heart in vivo. (A) Heart structure is relatively stable during diastole allowing acquisition of full image frames with no motion artifact [image adapted from Lee et al. (70) with permission]. (B–F) Line-by-line reconstruction enables volumetric reconstructions at any point within the cardiac or respiratory cycles. (B) Simultaneous recording of the electrocardiogram (ECG) and lung pressure during imaging produces image frames at a single Z-plane that are captured at various points in the cardiac and respiratory cycles. The R-wave peak of the ECG (red arrows) and inspiratory peak of the lung pressure (blue arrows) are defined as the start and end of the cardiac cycle and respiratory cycle, respectively. (C) Each 512 × 512 pixel image frame is produced by raster scanning the excitation laser in the X-direction, therefore each line has a defined position in Y, a depth in Z, and a time it was captured with respect to the cardiac cycle (cardiac time) and respiratory cycle (respiratory time). (D) Each Y, Z line in the image is associated with a phase in the cardiac and respiratory cycles (yellow spots). An image volume is reconstructed using image lines for each Y, Z position that occur at a specified part of respiratory and cardiac cycles (green shaded box). (E) The closest Y, Z position (green circle) to a requested point in cardio-respiratory phase space that is absent (red cross) can be used to completely fill a three-dimensional volume. (F) Reconstructed vasculature of the beating mouse heart during diastole. Vasculature is fluorescently labeled with a Texas Red dye conjugated to a 70 kDa dextran. Scale bar in A represents 20 μm.

