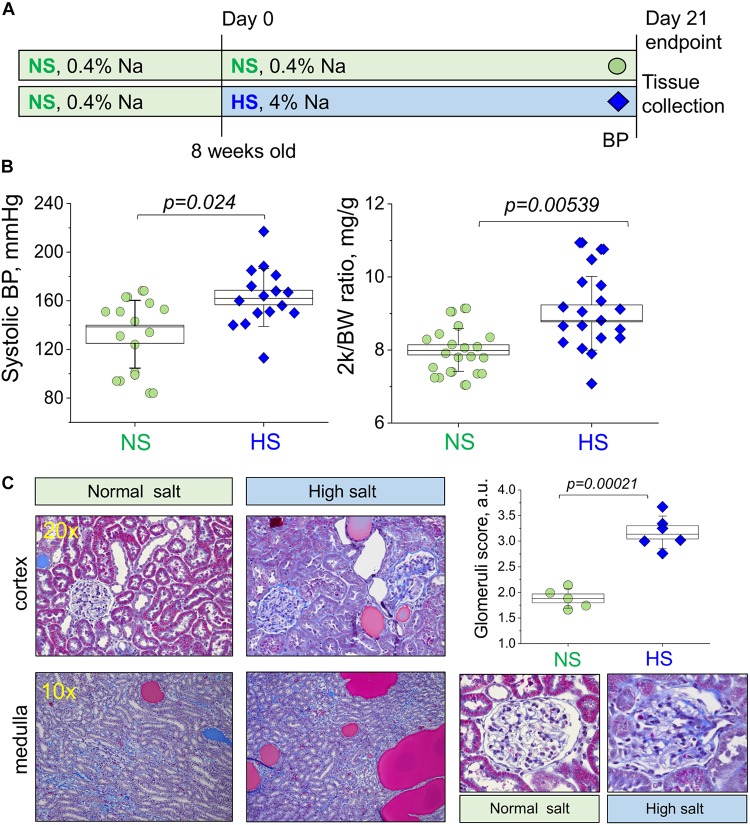
FIGURE 1.
Study protocol and development of the salt-sensitive (SS) hypertension in the Dahl SS rats. (A) Schematic representation of the experimental protocol used to induce SS hypertension in Dahl SS rats. (B) Graphs illustrating the observed increase in systolic blood pressure (systolic BP, left) and two kidney to body weight ratio (middle panel, 2 k/BW) in the NS diet fed group compared to a HS diet fed group (right). (C) Representative histological images showing cortical renal tissues (20×) and medullary tissues (10×) from NS and HS diet fed animals stained with Masson’s trichrome. Graph illustrates summarized glomerular damage score (glomeruli examples are provided below for each experimental group). All data were compared using a one-way ANOVA with Holm–Sidak post hoc test. In Graphs (B), each data point represents a single measurement from an experimental animal at the end of the protocol after the NS or HS challenges. For the glomerular damage score (C), each point is an average of 100 glomeruli blindly scored in the renal tissue of each animal. NS, normal salt; HS, high salt.

