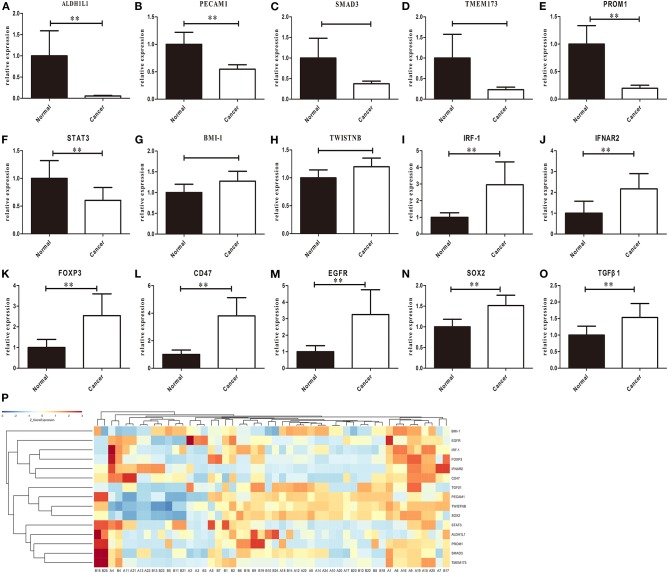
Figure 2.
RT-PCR results of ALDH1L1 (A), PECAM1 (B), SMAD3 (C), TMEM173 (D), PROM1 (E), STAT3 (F), BMI-1 (G), TWISTNB (H), IRF1 (I), IFNAR2 (J), FOXP3 (K), CD47 (L), EGFR (M), SOX2 (N), and TGFβ1 (O) expression in primary tumors. Each bar represents the average log2 gene mRNA expression level of the paired tumor and adjacent normal tissues (n = 25 per group). Eleven genes showed significant changes between paired tumor and adjacent normal tissues (P) Heatmap of gene expression profiles of HNSCC patients in the primary of HNSCC, Gene expression values are calculated based on the log transform of FPKM values determined from RNA sequencing analyses. High expression is depicted by red; low expression is depicted by green, normalized by row z scores (legend) (**p < 0.05, t-test).

