Fig. 3.
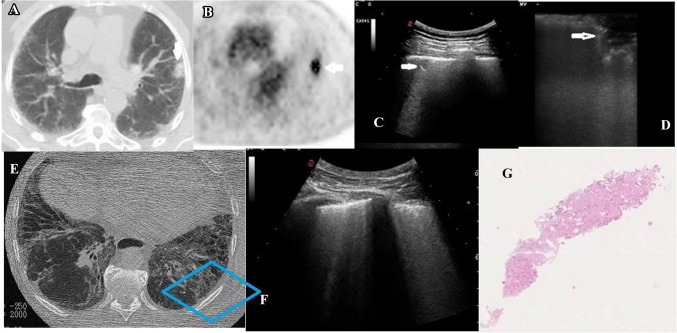
Chest CT (a), 18F-FDG PET/CT (b), TUS (c), VATS-US (d), chest HRCT (e), TUS (f), and histological examination of a patient with adenocarcinoma and pulmonary fibrosis (g). a Chest CT showing the lung nodule (white arrow); b18F-FDG PET/CT combined image showing increased glucose uptake and glycolysis of the nodule (white arrow); c TUS (convex probe; 5 MHz) showing the nodule adhering to the pleura (white arrow); d VATS-US (intraoperative linear probe) showing the nodule (white arrow) with jagged margins; e HRCT axial scan showing the patterns of fibrosis (blue box); f corresponding TUS scan showing increased thickness of the hyperechoic pleural line (white arrow) and increased number of B-lines below it; g histological examination of the nodule (hematoxylin eosin) showing adenocarcinoma in pulmonary fibrosis

