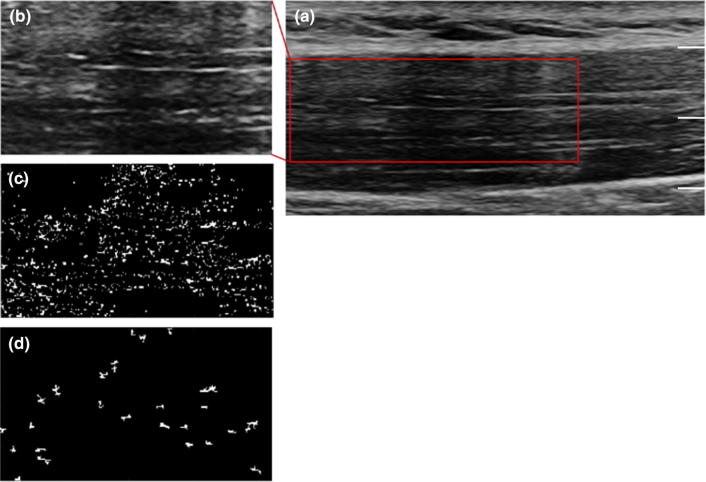
Fig. 1.
The B-mode Ultrasound gray-scale image of the upper trapezius muscle (a). b shows the selected region of interest for the blob analysis. The first round of identified blobs that have echo intensities outside the specified range is given by c. These blobs are filtered on the basis of their size using the specified area threshold. These residual blobs (shown in d) are counted and measured, generating Figs. 2 and 3. Scale: depth 2.0 cm

