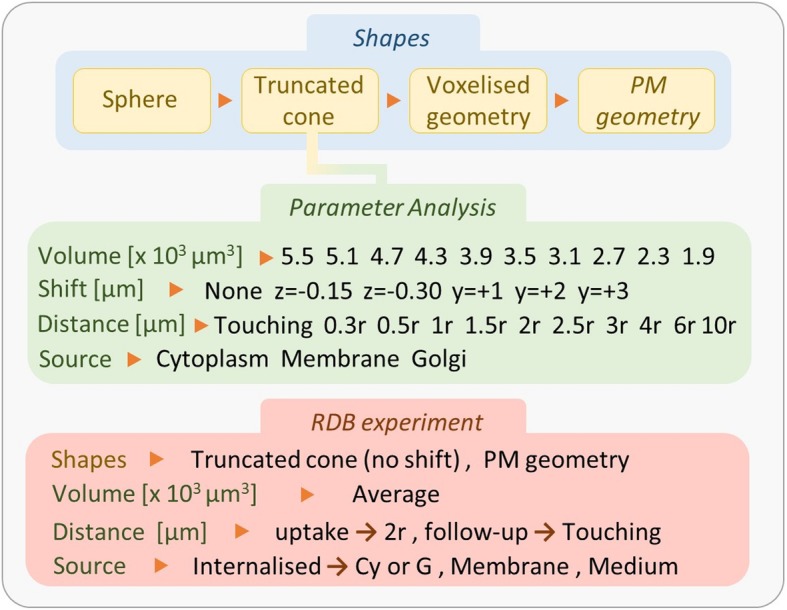
Fig. 3.

Schematic summary of the simulations performed for the parameter analysis with the truncated cone geometry (green area) and the in vitro experiment (red area). The position shifts of the nucleus are referred to the z- and y-axis. The relative distance between cells is indicated as multiples of the cell radius (“r”). Regarding the simulation of the in vitro experiment, during the 4-h uptake, the distance between cells was assumed constant and evaluated on average (1 cell diameter); in the next 6 days, cells were able to form colonies made of neighboring cells
