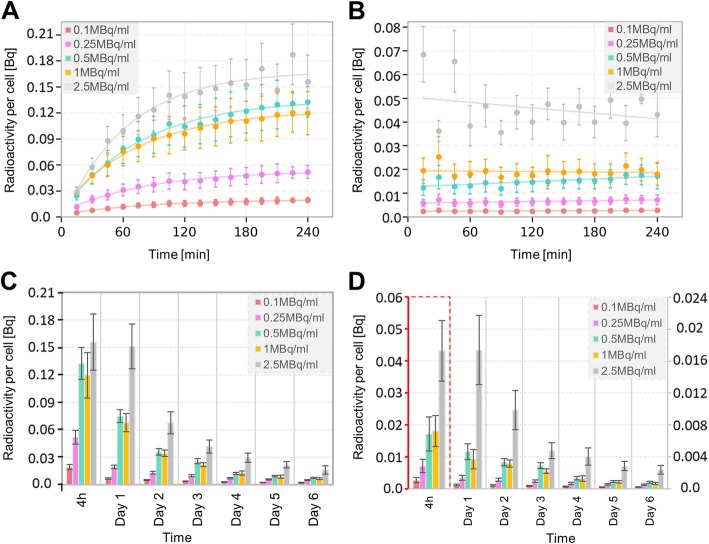
Fig. 7.
Activity quantification. Internalized a and b membrane bound activity curves per cell during the 4 h uptake. Internalized c and d membrane bound activity per cell at the end of the 4 h uptake and in each following day. The curves corresponding to 0.1 MBq/ml and 0.25 MBq/ml are extrapolated. The error bars indicate the SD of uptake data

