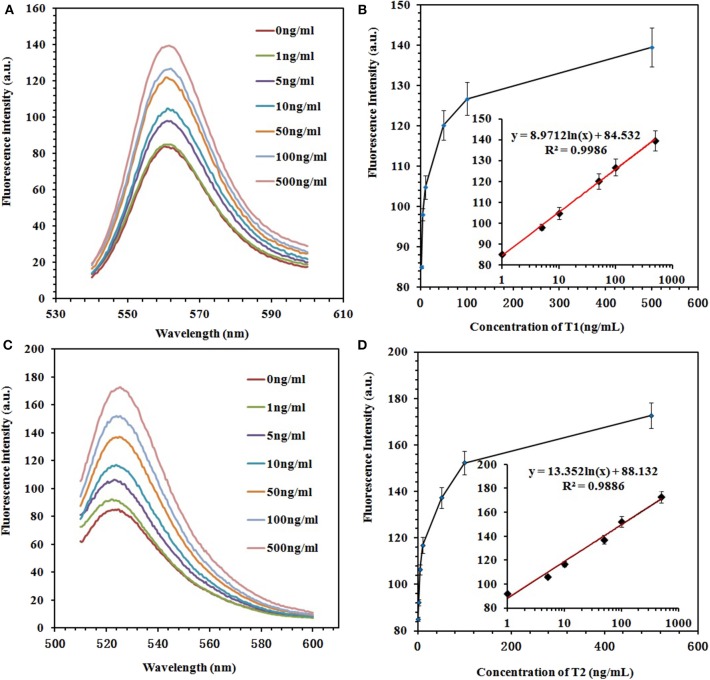
Figure 5.
(A) Fluorescence emission spectra of the GO–APT1 complex (30 μg/ml; 20 nM) in the presence of ZEN (0, 1, 5, 10, 50, 100, and 500 ng/ml). (B) Calibration plot of ZEN with a concentration range of 1–500 ng/ml. (C) Fluorescence emission spectra of the GO–APT2 complex (30 μg/ml; 20 nM) in the presence of OTA (0, 1, 5, 10, 50, 100, and 500 ng/ml). (D) Calibration plot of OTA with a concentration range of 1–500 ng/ml.

