
Figure 1.
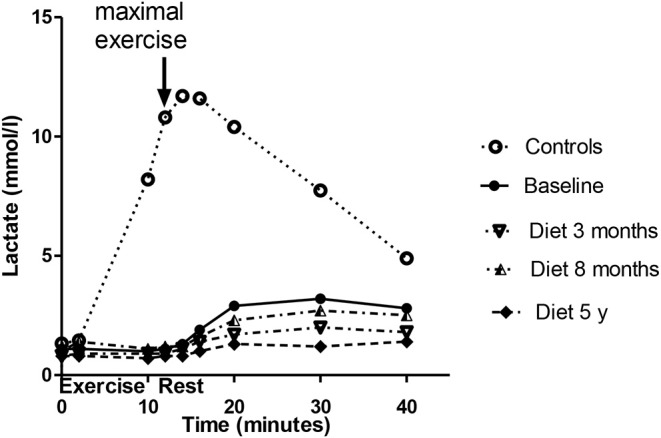
Lactate levels associated with exercise tests of the patient before diet and during the follow-up. The values of the control subjects without dietary intervention are also given for comparison. The baseline lactate data has been published earlier (10), the controls matched to the age and gender of the patient were obtained from the forementioned publication. A strong correlation existed between the patient's baseline lactate values and his diet curves at 3, 7 months, and 5 years, rho being 0.914 (p = 0.006), 0.885 (p = 0.015), and 0.90 (p = 0.001), respectively.