Figure 1.
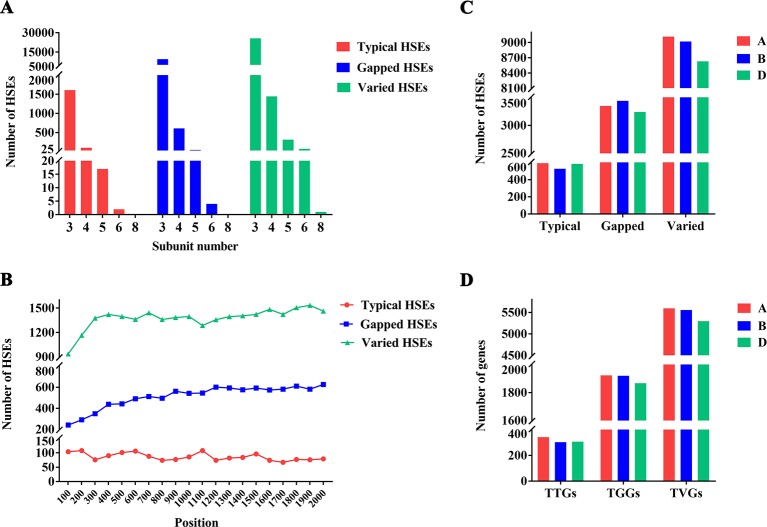
Distribution of HSEs and its CDGs in wheat genome (A) Number of different HSE types. The x-axis represents the subunits and the y-axis represents the number of HSEs. Red, blue, and green represent the number of typical HSEs, gapped HSEs, and varied HSEs, respectively. (B) Positions of different types of HSEs within promoters. The x-axis represents the position. The “0” indicates the “TSS” and the “2000” indicates the upstream 2000th bp of TSS. The y-axis represents the number of HSEs. Red, blue, and green represent the number of typical HSEs, gapped HSEs, and varied HSEs, respectively. (C) Distribution of HSEs among three wheat subgenomes. The x-axis represents the different types of HSEs and the y-axis represents the number of HSEs. Red, blue, and green represent the (A, B, D) subgenome, respectively. (D) Distribution of genes containing different types of HSEs among three wheat subgenomes. The x-axis represents the genes containing different types of HSEs and the y-axis represents the number of genes. Red, blue, and green represent the A, B, and D subgenome, respectively.

