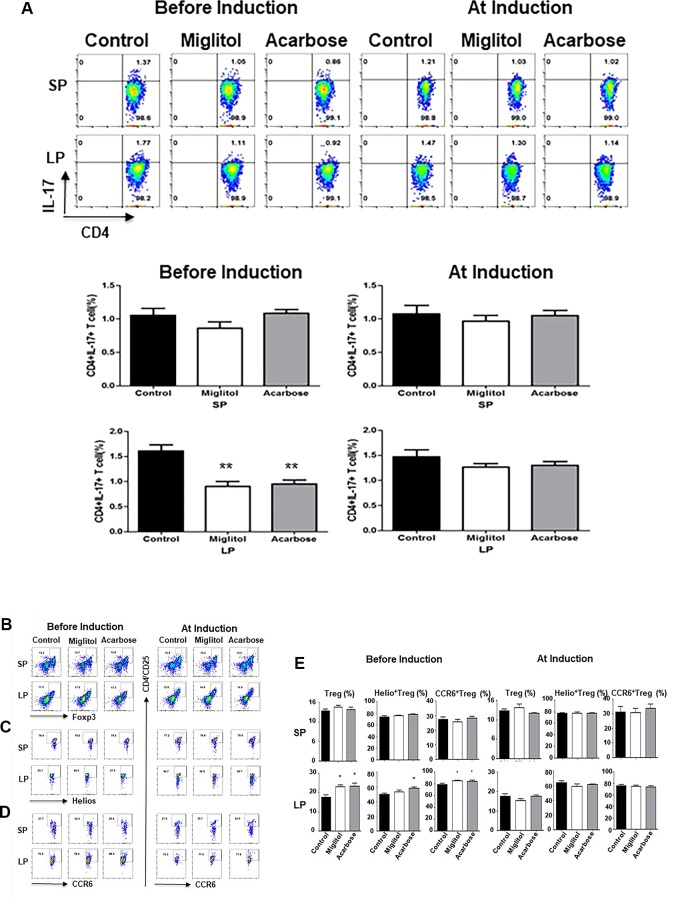
Figure 3.
α-glucosidase inhibitor treatment on the mouse spleen and intestinal immune systems. Mice were treated with acarbose, miglitol or water as in Figure 1 (Befosre Induction or At Induction). The number of Th17 and Treg cells in mouse spleen and gut lamina propria was analyzed using flow cytometry. (A) Th17 cells: Lymphocytes were stimulated and stained with CD4 and IL-17A antibodies. Each dot plot shows data from one representative mouse of each group. The number in the right upper quadrant indicates the percentage of CD4+IL-17+ lymphocytes. Bar graphs represent the data expressed as mean ± SEM. (B–E) Treg cells: Percentage of Treg cells (CD4+CD25+Foxp3+) (B), Helio+ Treg cells (CD4+CD25+Foxp3+Helios+) (C) and CCR6+ Treg cells (CD4+CD25+Foxp3+CCR6+) (D) was quantified by flow cytometry. Each dot plot shows data from one representative mouse of each group. (E) Bar graphs represent the data of total Treg, Helio+ Treg and CCR6+ Treg cells expressed as mean ± SEM. These results were average of two independent experiments, 7-10 mice per group. *p < 0.05, **p < 0.01, vs control group.

