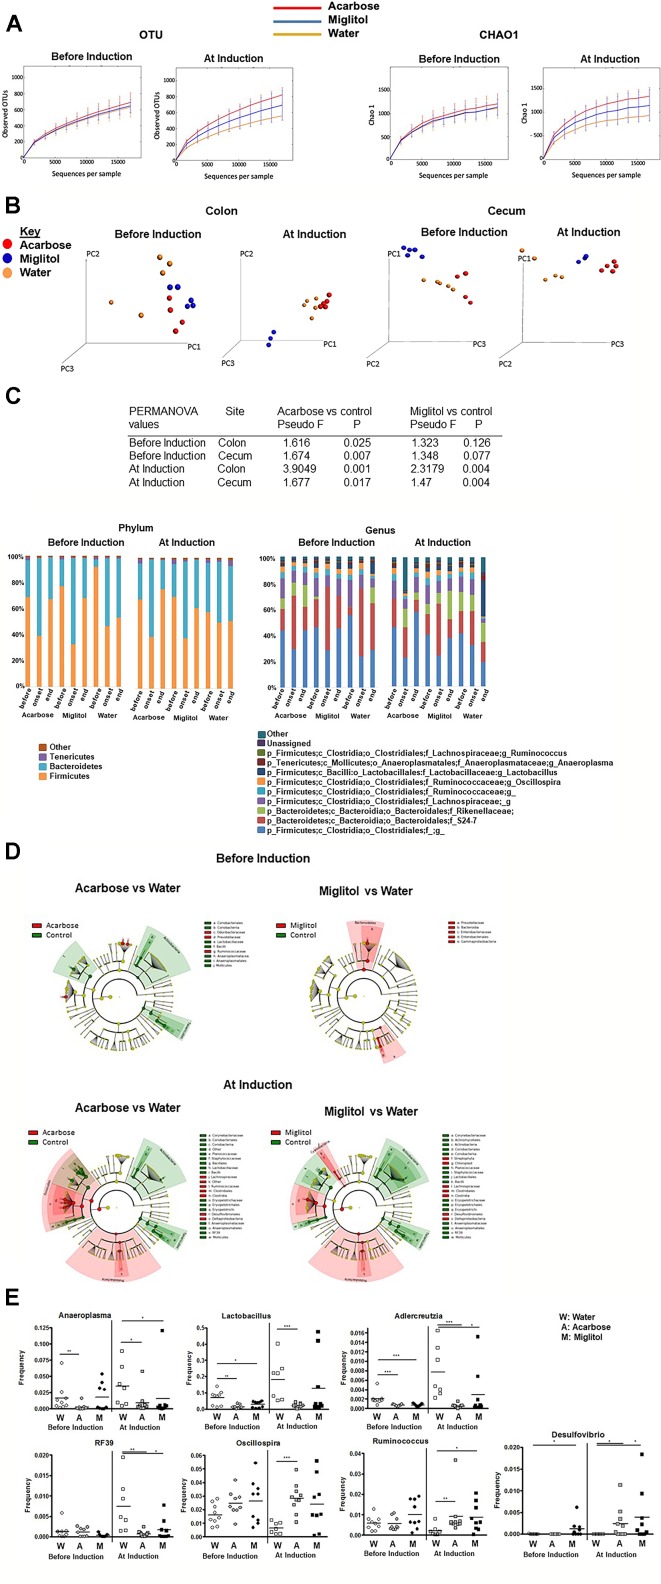
Figure 4.
Alteration in microbial community by α-glucosidase inhibitors. Mice were treated with acarbose, miglitol or water as in Figure 1 (Before Induction or At Induction). (A) Alpha diversity of intestinal microbiota as represented by number of observed OTUs and Chao1 estimator. (B) Principal coordinate analysis (PCoA) plots displaying Beta diversity of microbiota by treatment group using unweighted UniFrac distances. (C) The composition of gut microbiota in colon at the phylum (left) and genus (right) levels. Each phylum/genus is represented by different color and its proportion of relative abundance per sample. Genera were filtered for those with ≥0.1% of total abundance. If full identification was not possible, f_ or g_ alone was used for family or genus, respectively. (D) Cladogram representing the most differentially abundant taxa enriched in microbiota from α-glucosidase inhibitors and control mice generated from LEfSe analysis. The central point represents the root of the tree (Bacteria), and each ring represents the next lower taxonomic level (phylum through genus). The diameter of each circle represents the relative abundance of the taxon. (E) Relative abundance of Lactobacillus, Anaeroplasma, Adlercreutzia, RF39, Oscillospira, Ruminococcus and Desulfovibrio; asterisks indicate level of significance by Mann–Whitney U test. These results consist of the average of two independent experiments, 7–10 mice per group. Mean values ± SEM are plotted; *p < 0.05, **p < 0.01, ***p < 0.001.

