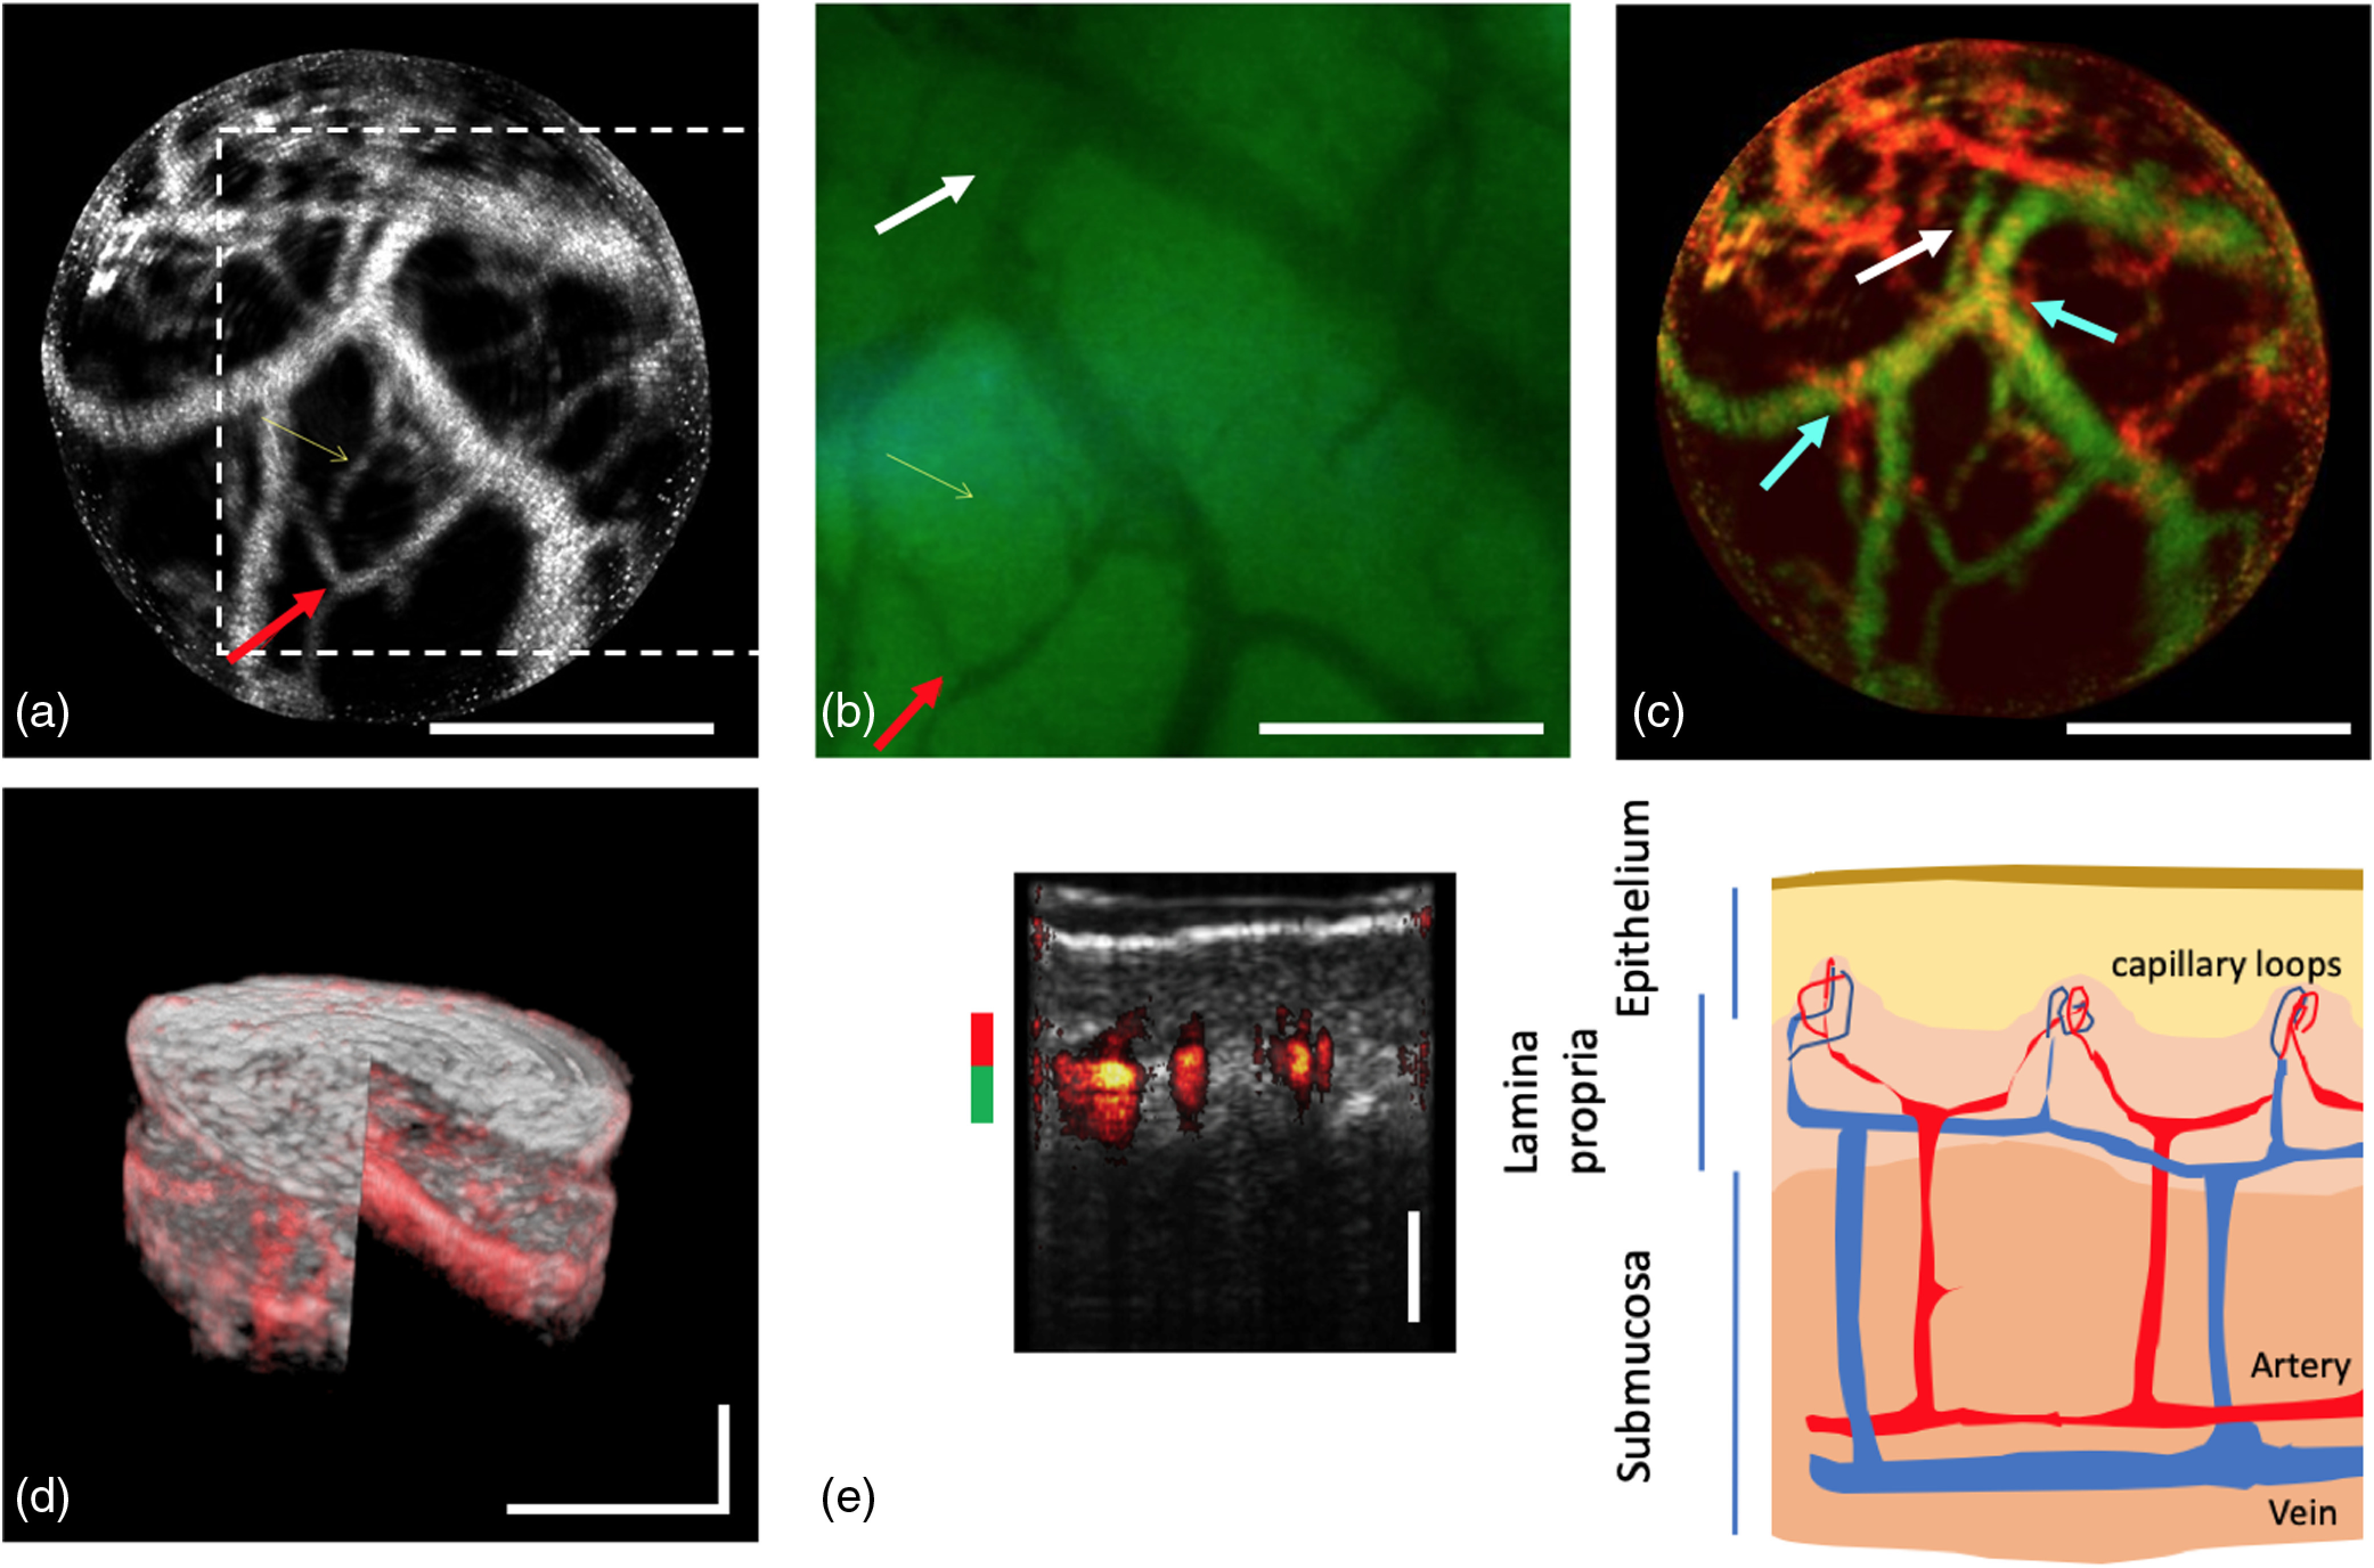
Fig. 2.

Images of the buccal mucosa obtained with the bimodal endoscope and schematic image of its structure. (a) En-face OCTA projection image at to depth inside the tissue with indication of NBI FOV in white dotted box. (b) Narrow-band image. (c) Depth color-coded projection image (color code in e). (d) Merged 3-D representation of OCT and OCTA data set. (e) Cross-sectional overlay tomogram (10 times averaged) and correlation to anatomy of buccal mucosa. Red arrow in (a) and (b) points out the identical vessel branch for orientation; white arrow in (b) and (c) points at a deeper located vessel that cannot be seen with NBI; cyan arrows in (c) point out vessel crossing of superficial capillaries. Scale bar: .
