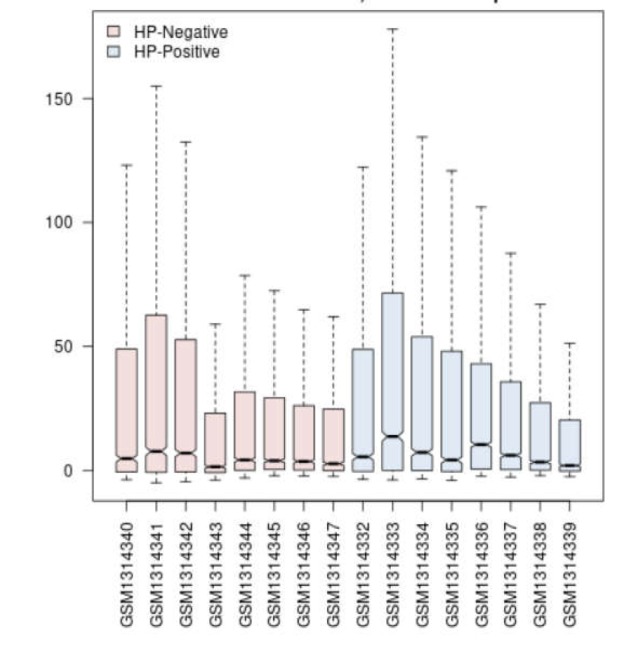
Figure 1.

A comparison of gene expression profiles of two groups of 16 samples of non-cancerous HP negative (pink) and HP positive (blue). The x-axis and y-axis indicate the range of expression and biological replications for both groups, respectively
