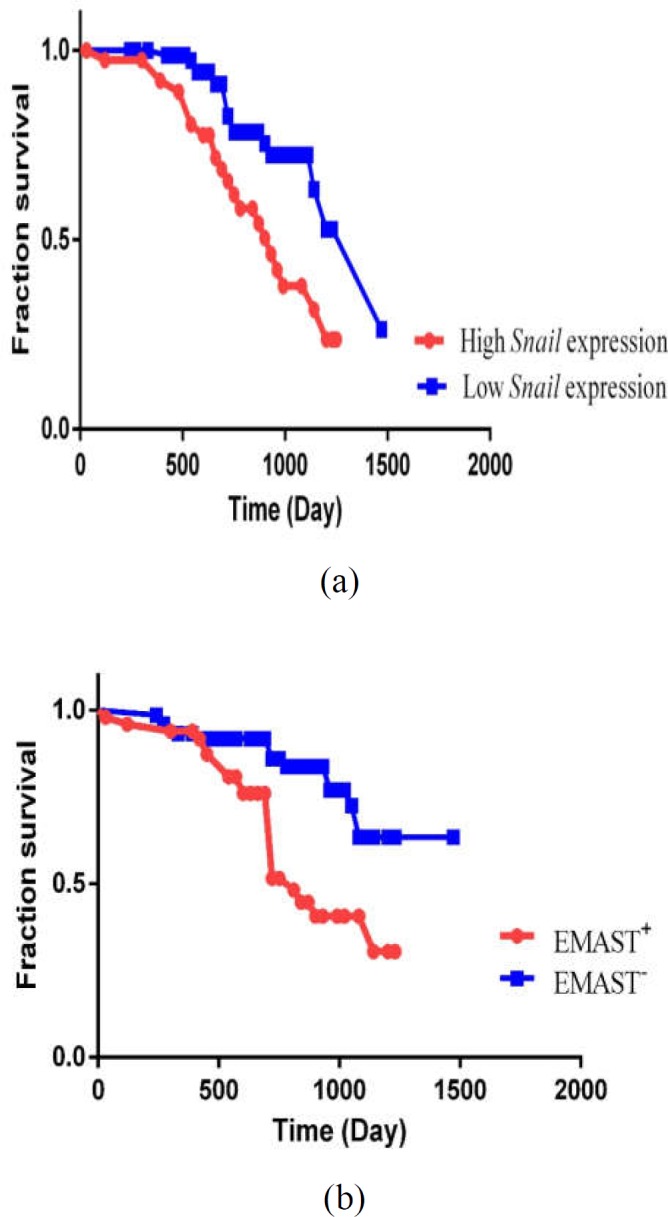
Figure 3.

Kaplan–Meier curve of 122 CRC patients; (A) Survival analysis according to Snail1 expression; Patients with higher expression of Snail1 had poorer survival than those with lower expression of Snail1 (P = 0.01). (B) Survival analysis according to EMAST status; Kaplan-Meier univariate analysis demonstrated a significantly decreased survival probability in patients with EMAST+ phenotype (P =< 0.001)
