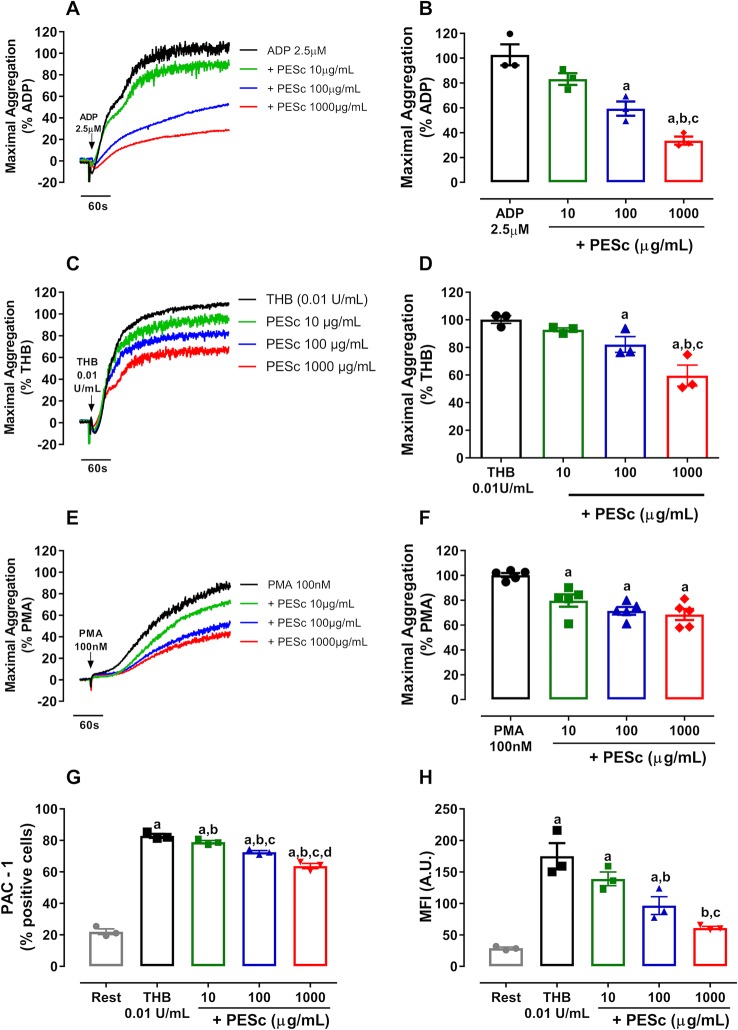
Figure 1.
PESc inhibits platelet aggregation and integrin αIIbβ3 activation. Platelet-rich plasma was pretreated with PESc (10, 100, or 1,000 μg/ml) for 25 min and stimulated with ADP (A), thrombin (THB, C), or PMA (E). Quantified data is shown next to representative curves for ADP (B), thrombin (D), and PMA (F) stimulated platelet aggregation. Washed platelets were pre-treated with PESc under the same conditions, stimulated with thrombin, and incubated with PAC-1 antibody to measure integrin activation. (G) Percentage of PAC-1 positive events. (H) Mean fluorescence intensity (MFI) of events. a p < 0.05 vs first column of graph. b p < 0.05 vs second column of graph. c p < 0.05 vs third column of graph, d p < 0.05 vs fourth column of graph. Data analyzed by paired one-way ANOVA and Tukey as post-test. All bar graphs represent mean ± SEM and individual data points of at least three independent experiments. Arrows indicate when agonists were added.

