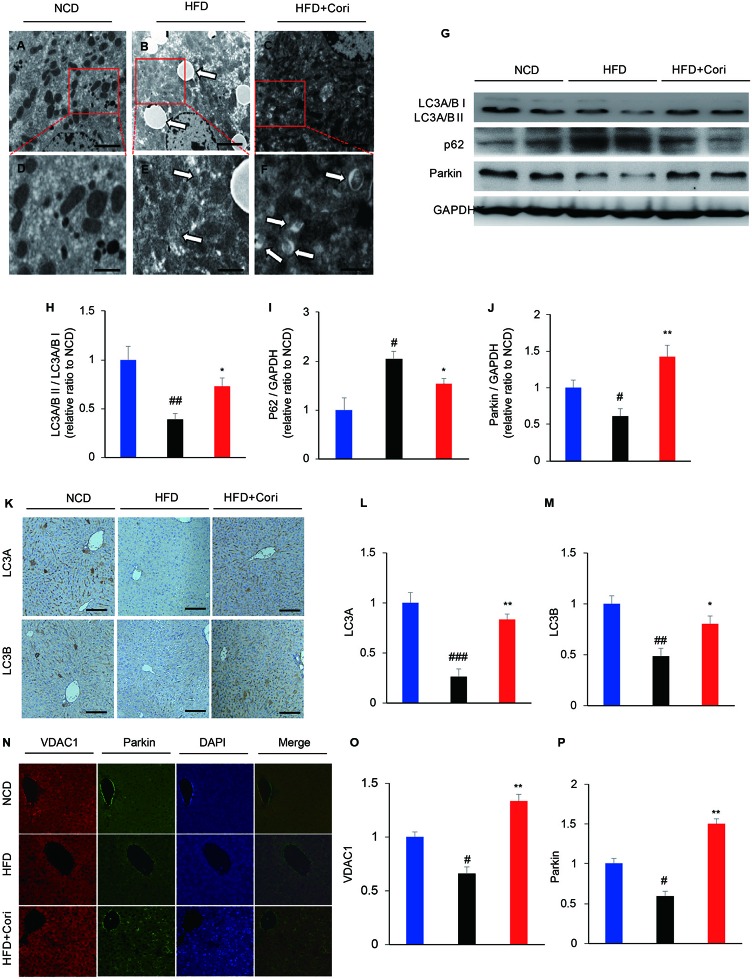
Figure 2.
Cori ameliorated lipid deposition by enhancing autophagy levels in liver of high-fat diet (HFD)-induced C57BL6 mice. (A–F) Transmission electron micrographic (TEM) analysis of liver sections from normal chow diet (NCD) mice (A, highlighted in D), HFD mice (B, highlighted in E), HFD+Cori mice (C, highlighted in F). (A–C magnification × 5 × 10³; D–F magnification ×2×10⁴). The white arrows highlight lipid droplets (B), deformed mitochondria (E) or autophagosomes (F). Scale bars = 2 μm (A–C) and 0.5 μm (D–F). (G) Western blot and (H–J) semiquantitative analysis of autophagy related protein LC3A/B I, LC3A/B II, p62, Parkin in livers of each group. GAPDH was detected as a loading control (H–J). (K) Immunohistochemistry and (L, M) quantitative analysis of LC3A, LC3B in livers of each group. Images of cells were visualized by fluorescent microscope (magnification ×200). (N) Immunofluorescence and (O, P) quantitative analysis of Parkin (green) and the mitochondrial marker VDAC1 (red) in liver of mice (yellow/orange positive fields represented Parkin/VDAC1 double labeled mitochondria). Images of cells were visualized by fluorescent microscope (magnification ×400). All data are presented as means ± SD (n = 10 mice/group). #p < 0.05, ##p < 0.01, ###p < 0.001 vs. NCD group; *p < 0.05, **p < 0.01 vs. HFD group.

