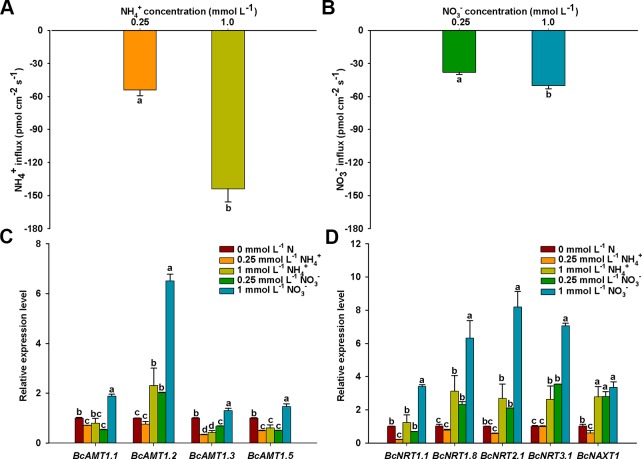
Figure 2.
NO3 – and NH4 + net fluxes and expressions of BcAMTs and BcNRTs in B. campestris roots in response to treatments with different N levels. (A) Net NH4 + fluxes in different NH4 + levels (0.25, and 1 mmol L–1 NH4 +). (B) Net NO3 – fluxes in different NO3 – levels (0.25, and 1 mmol L–1 NO3 –). (C, D) BcAMTs and BcNRTs expression in different N levels, respectively (0.25, and 1 mmol L–1 NH4 +/NO3 –). GAPDH was used as internal control. The data represent the mean ± SE (n = 6 in A–B, n = 3 in C–D). Significant differences (P < 0.05) between treatments are indicated by different letters.

