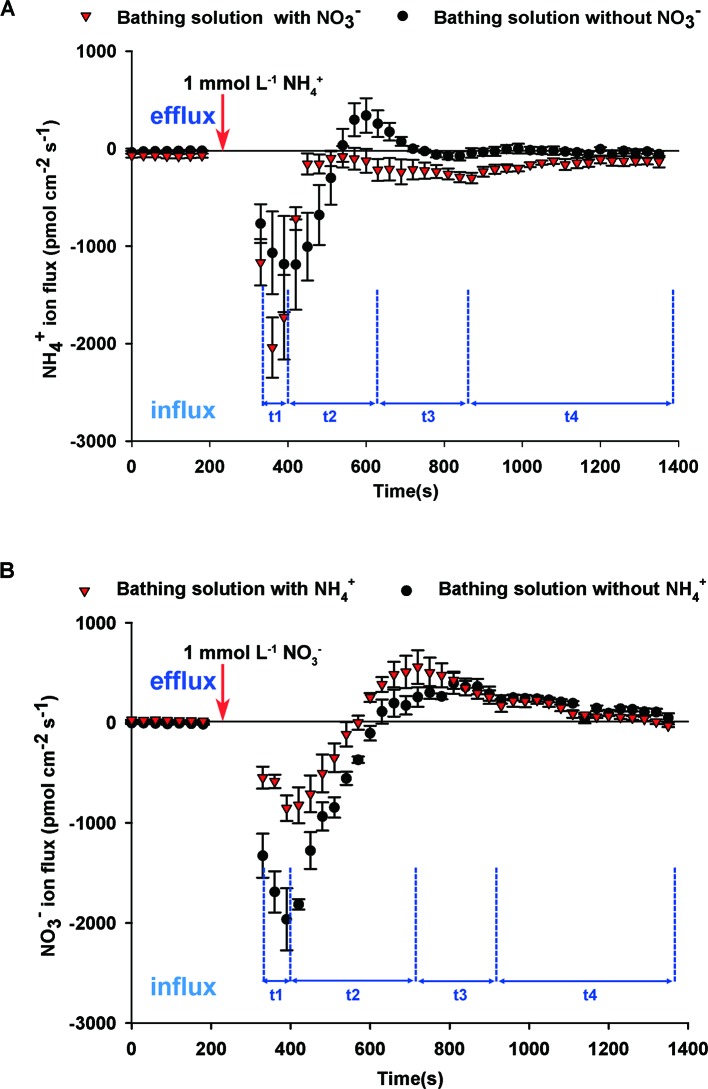
Figure 3.
Interaction between NO3 – and NH4 + fluxes on root surfaces of B. campestris. (A) Influence of NO3 – on net NH4 + fluxes after adding 1 mmol L–1 NH4 + to the bathing solution with or without 1 mmol L–1 NO3 –. (B) Influence of NH4 + on net NO3 – fluxes after adding 1 mmol L–1 NO3 – to the bathing solution with or without 1 mmol L–1 NH4 +. Changes in net NH4 +/NO3 – fluxes in roots at 30 s intervals are presented. The vertical arrow indicates the point at which 1 mmol L–1 NH4 + or NO3 – was added. t1–t4 represent the stages of net NH4 +/NO3 – fluxes after adding NH4 +/NO3 – to the bathing solution. The data represent the mean ± SE (n = 4–6) during the measurement period.

