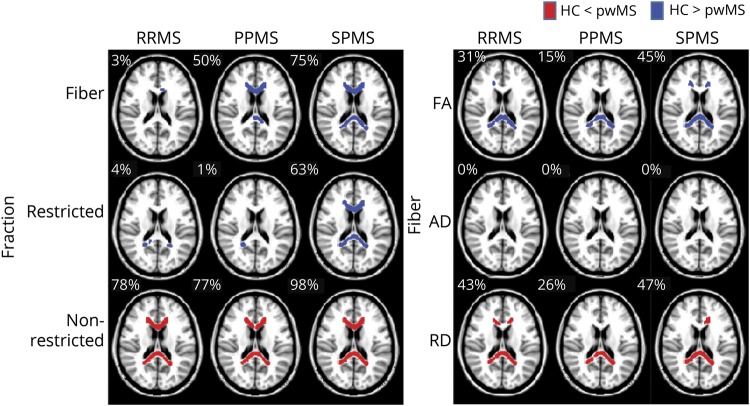
Figure 1. TBSS-based DBSI of normal-appearing corpus callosum revealed widespread abnormalities in fiber fraction, nonrestricted fraction, fractional anisotropy, and radial diffusivity compared with healthy controls.
DBSI metrics in the three clinical subgroups of RRMS, PPMS, and SPMS were compared with healthy controls (HCs). Regions in red or blue represent regions with a significant increase or decrease in that diffusion metric in pwMS compared with HC, respectively. The proportion of the CC volumes that were significantly different from the HC group is indicated at the upper left corner of each map. In the figures, the TBSS skeleton was thickened for better visibility. CC = corpus callosum; DBSI = diffusion basis spectrum imaging; PPMS = primary progressive MS; pwMS = people with MS; RRMS = relapsing-remitting MS; SPMS = secondary progressive MS; TBSI = tract-based spatial statistics.

