
Figure 2. Newly Generated DGCs Highly Express S1PR1.
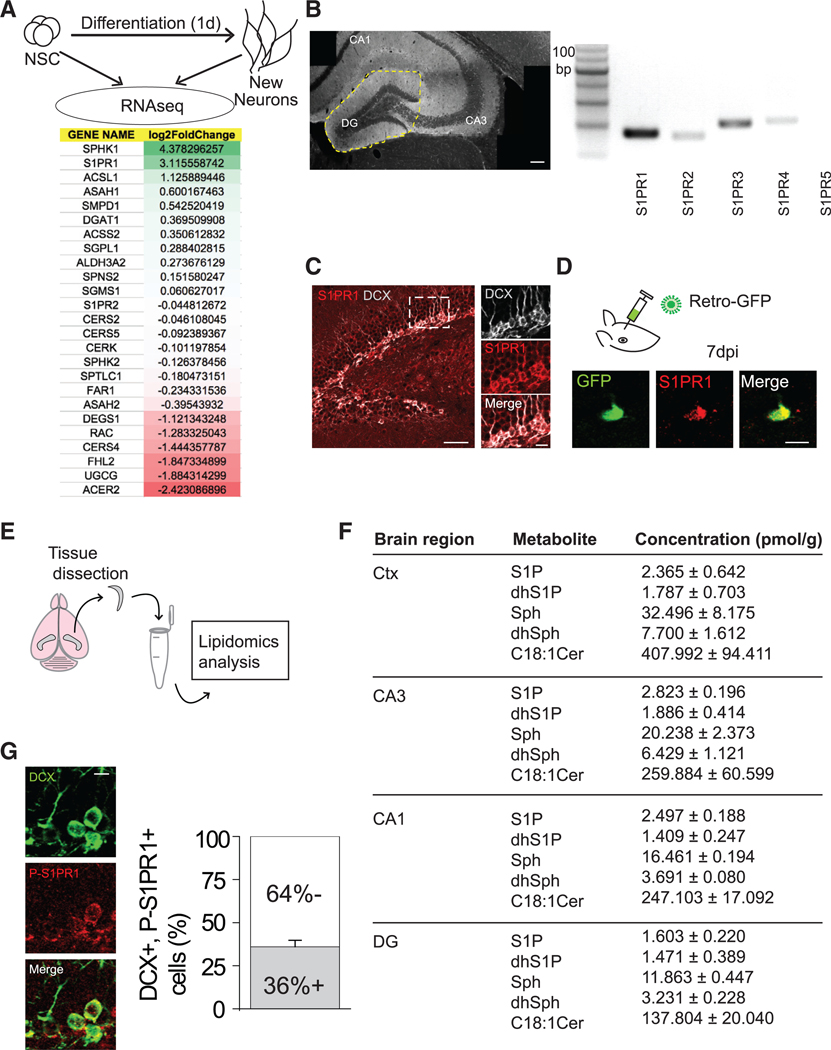
(A) (Top) Procedure for RNA-seq analysis of new neurons 1 day after differentiating from adult hippocampal neural stem cells. (Bottom) Expression profiling of sphingolipid signaling-related genes. Mann-Whitney U test, SPHK1 p = 0.064, S1PR1 p = 0.064, ACSL1 p = 0.064, ASAH1 p = 0.064, SMPD1 p = 0.064, DGAT1 p = 0.064, ACSS2 p = 0.355, SGPL1 p = 0.064, ALDH3A2 p = 0.04, SPNS2 p = 1.000, SGMS1 p = 0.064, S1PR2 p = 0.165, CERS2 p = 0.064, CERS5 p = 0.355, CERK p = 0.355, SPHK2 p = 0.064, SPTLC1 p = 1.000, FAR1 p = 0.064, ASAH2 p = 0.643, DEGS1 p = 0.060, RAC p = 0.165, CERS4 p = 0.064, FHL2 p =1.000, UGCG p = 0.06, ACER2 p = 0.643.
(B) (Left) Region of dentate gyrus dissected. (Right) S1PR isoform mRNA detection (S1PR5 was not detected). Scale bar, 100 μm.
(C) (Left) Representative image of the dentate gyrus immunostained for DCX and S1PR1. Scale bar, 50 μm. (Right) Magnified view of the region outlined in the image on the left. Scale bar, 10 μm. (Related to Figures S1 and S2).
(D) (Top) Retroviral GFP was delivered to the DG to label newly born DGCs. (Bottom) Representative image showing expression of S1PR1 in a DGC at 7 dpi. Scale bar, 10 μm.
(E) Schematic of hippocampal/cortical dissection and lipidomics analysis.
(F) Concentrations of various sphingolipid metabolites in several brain regions. DG versus Ctx: p < 0.0001 (two-way ANOVA), followed by post hoc LSD tests, Sph p < 0.05, dhSph p < 0.05, S1P p = 0.32, dsS1P p = 0.738, Cer18:1 p < 0.001. Experiment repeated in triplicates. Cer, ceramide; Ctx, cortex; DG, dentate gyrus; S1P, sphingosine1-phosphate; dhS1P, dihydrosphingosine 1phosphate; Sph, sphingosine; dhSph, dihydrosphingosine.
(G) (Left) Representative image of DCX and phospho (Thr236)-S1PR1 (P-S1PR1) immunostaining in the DG. Scale bar, 10 μm. (Right). Quantification of the proportion of DCX+ cells immunopositive for P-S1PR1 (n = 3–4). Error bars represent standard error of mean.