
Figure 4. Environmental Enrichment Accelerates the Horizontal-to-Radial Repositioning of Newly Generated DGCs via S1PR1 Activation.
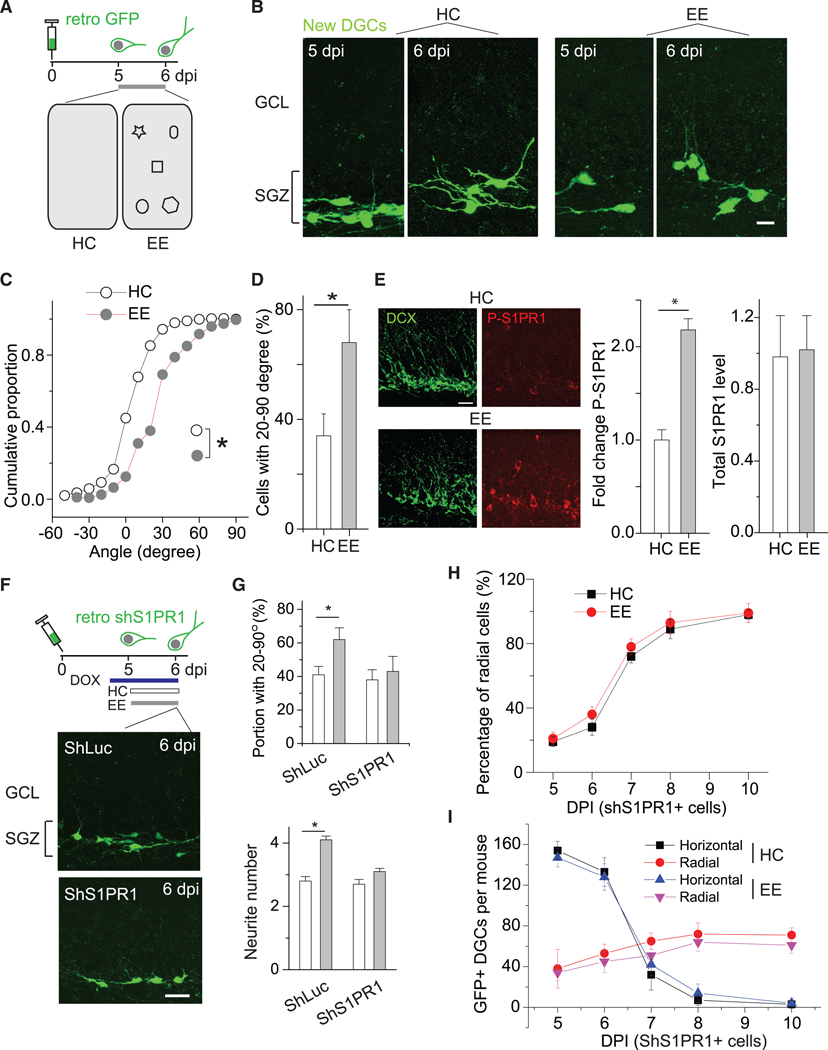
(A) Schematic showing the experimental design, including the timeline for viral labeling and experiments (top) and two environments, HC and EE (bottom). HC, home cage; EE, enriched environment.
(B) Sample images of GFP+ newly generated DGCs at 5 and 6 dpi from both HC and EE conditions. Scale bar, 10 μm.
(C) Plot of the distribution of primary neurite angles of newly generated DGCs under either HC or EE conditions. *p < 0.05 (n = 5 mice for HC and n = 6 for EE; Kolmogorov-Smirnov test).
(D) Summary plot of the proportion of newly generated DGCs with radial primary neurites of 20°−90°at 6 dpi under HC and EE conditions. *p < 0.05 (n = 3–4 mice; two-tailed unpaired t test).
(E) (Left) Representative images showing phosph-S1PR1 in DCX+ new DGCs under HC and EE conditions. (Right) Summary of S1PR1 and P-S1PR1 levels in DCX+ cells. *p < 0.05 (n = 4 mice for HC and n = 3 for EE; two-tailed unpaired t tests).
(F) Experimental outline (top) and representative images of GFP+ shS1PR1- and shLuc-expressing DGCs at 6 dpi (bottom) under HC conditions. Scale bar, 20 μm.
(G) Summary of the portion of DGCs with angles between 20°and 90°at 6 dpi from mice under HC and EE conditions. *p < 0.05 (shLuc), p = 0.330 (shS1PR1) (two-tailed unpaired t test) (top). Summary of the numbers of neurites from DGCs at 6 dpi from mice under HC and EE conditions. *p < 0.01 (shLuc), p > 0.05 (shS1PR1) (n = 5 mice; two-tailed unpaired t test) (bottom). Related to Figures S3 and S4.
(H) Summary of percentages of radially positioned GFP+ DGCs at 5, 6,7,8,and10 dpi under HC and EE conditions(n= 3–5mice per group and developmental stage).
(I) Summary of the numbers of GFP+ DGCs (shS1PR1) at 5, 6, 7, 8, and 10 dpi under HC and EE conditions (n = 3–5 mice per group and developmental stage). Error bars represent standard error of mean.