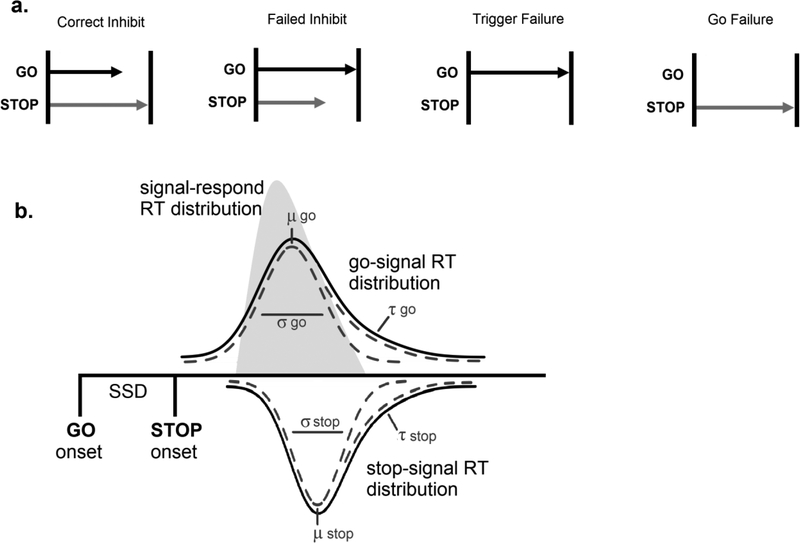
Figure 1.
Schematics of the horse race and ex-Gaussian models of stop-signal task performance. a) Demonstration of single trial horse races (assuming SSD=0) in which the stop process wins the race (correct inhibit), in which the go process wins the race (failed inhibit), in which the stop process fails to be triggered (trigger failure), and in which the go process fails to be triggered (go failure). b) Schematic of the ex-Gaussian race model, adapted from Matzke et al. (2017), in which the signal-respond RT distribution (light gray) is given by a go RT distribution censored by a stop-signal RT distribution, both of which is assumed to be ex-Gaussian in shape.

