
Figure 2.
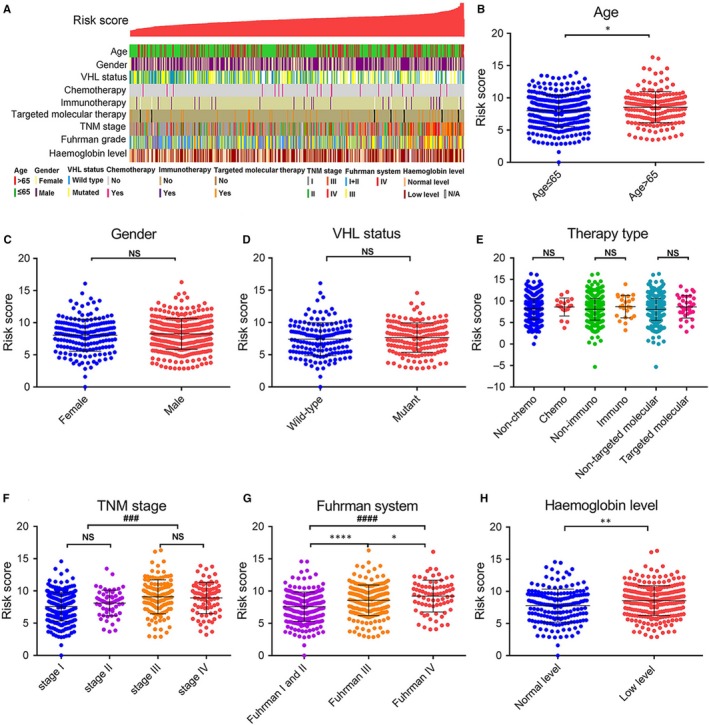
Relationship between the predictive signature risk score and clinicopathologic characteristics. A, The clinicopathologic information of patients in TCGA database, arranged by the increasing risk score. The distribution of risk score in patients stratified by age (B), gender (C), VHL status (D), therapy type (E), TNM stage (F), Fuhrman grade (G) and haemoglobin level (H). *P values were measured by unpaired t test. *P < .05, **P < .01, ***P < .001, ****P < .0001. #, one‐way ANOVA for different pathological stages. ###P < .001, ####P < .0001