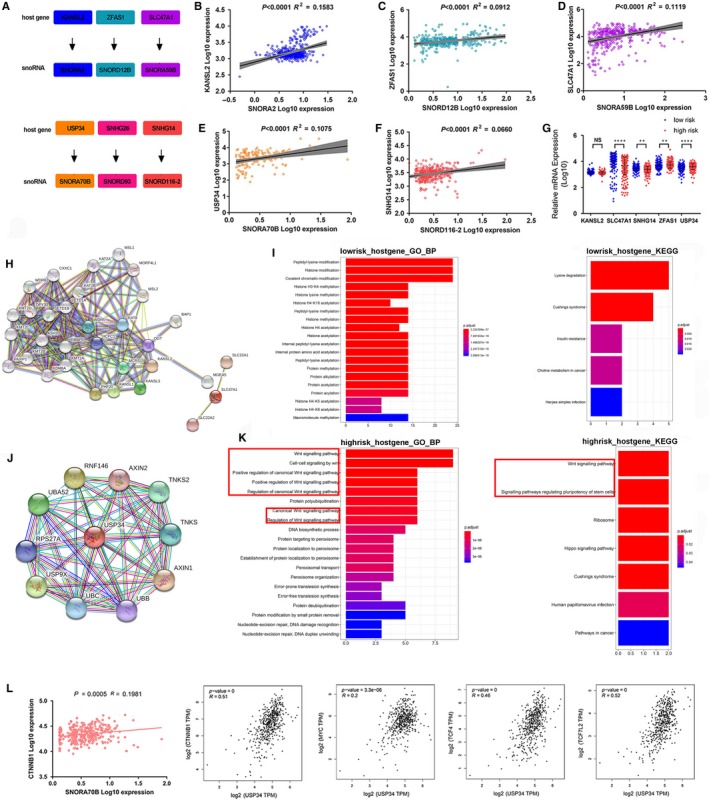
Figure 6.

The function analysis of the host genes of these six snoRNAs. A, The host genes of six snoRNAs. (B‐F) The correlation between host genes and snoRNAs. G, The differential expression of snoRNAs' host genes between high‐risk and low‐risk groups. Protein‐protein interaction analysis of snoRNP genes highly correlated with low‐risk snoRNAs (H) and high‐risk snoRNAs (J) by STRING tool. Biological process analysis and KEGG analysis of snoRNP genes highly correlated with low‐risk snoRNAs (I) and high‐risk snoRNAs (K) by clusterProfiler package. (L) The correlation between SNORA70B and CTNBB1, and between SNORA70B host gene USP34 and CTNBB1, MYC, TCF4 and TCF7L2
