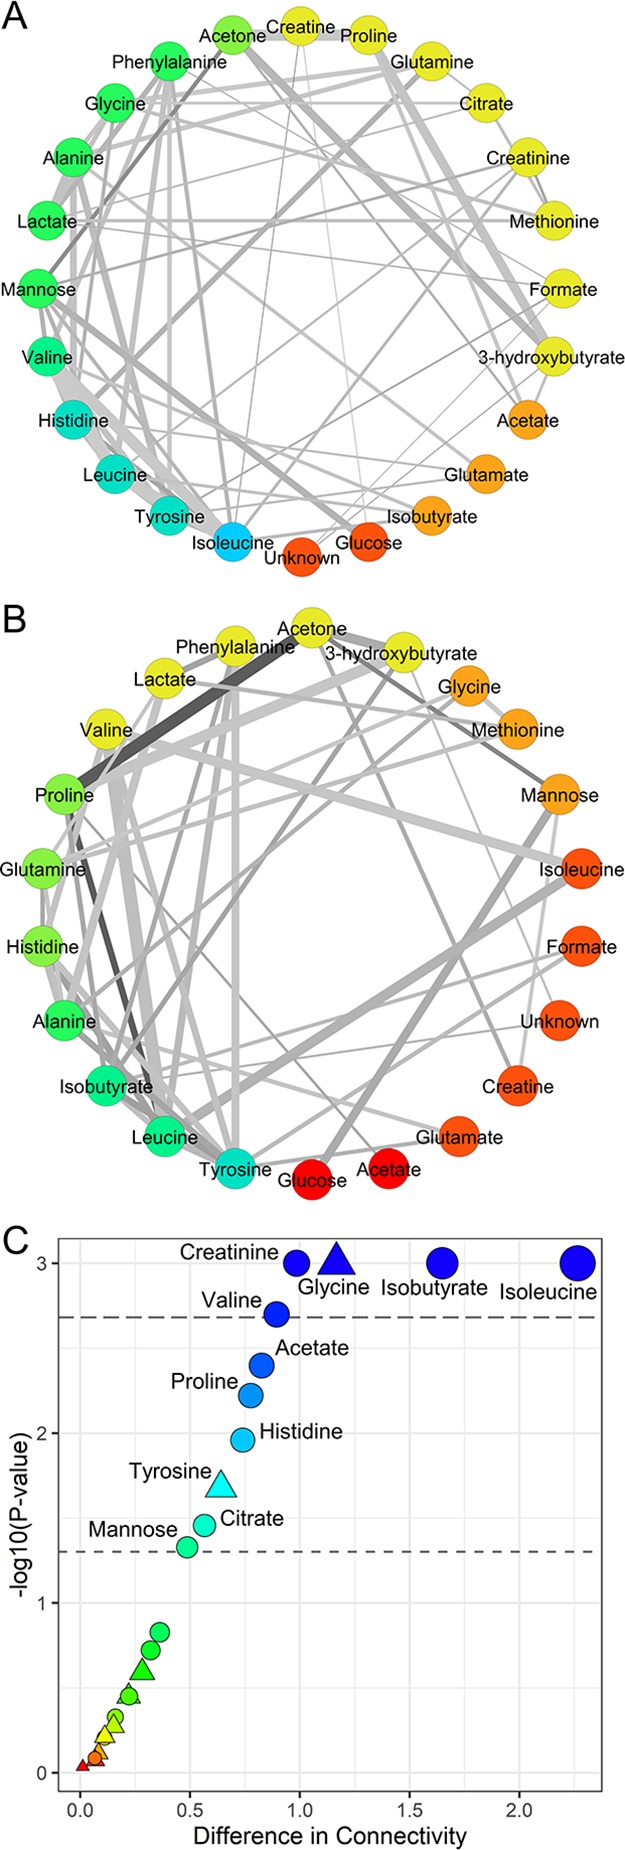
Figure 3.

Metabolite–metabolite association networks reconstructed using the PCLRC algorithm from the serum metabolite concentration profiles. (A) Survived and (B) deceased AMI patients within 2 years from the cardiovascular event; vertexes are colored according to the metabolite degree of connectivity. (C) Differences in terms of connectivities in networks of survived and deceased are reported against each metabolite’s P-value. The thresholds for significance at 0.05 and after Bonferroni correction are given. The colors red to blue encode for the increasing difference. Significance in terms of metabolite levels is also reported: circles are metabolites that are statically different between survived and deceased patients, whereas triangles encode for the not significant ones.
